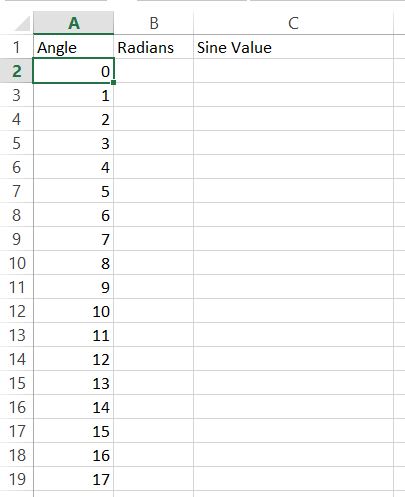
How to graph a sine wave?
In this Excel charting tutorial, you can learn how to graph a sine wave.
Excel Skills Simplified: Tutorials That Actually Work
In this Excel charting tutorial, you can learn how to graph a sine wave.
In this Excel lesson you will teach yourself a lot about difference any kind in Excel.
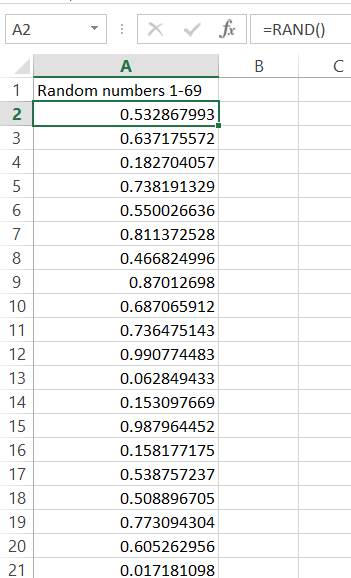
In this Excel tutorial lesson, you will learn how to prepare a lottery number generator sheet in Excel.
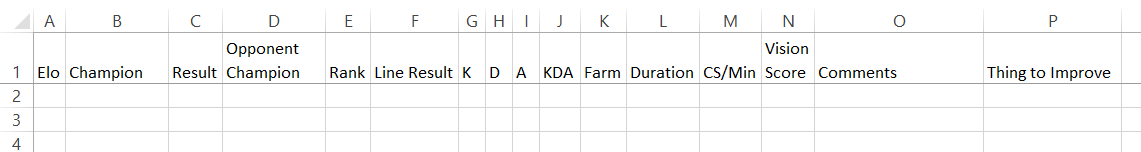
League of Legends is my favourite computer game. I’m also an Excel freak. See the League of Legends Trakcer spreadsheet I’m using to track my lol games.
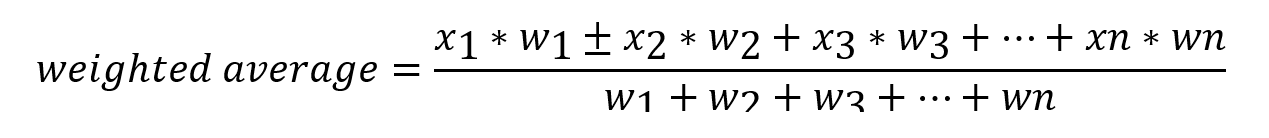
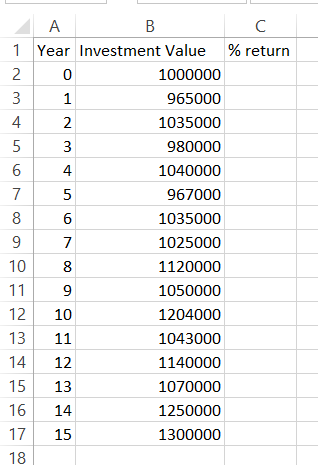
In this Excel lesson, you will learn what is weighted average, how and when to use it. Also you will see many examples how to handle a weighted average in Excel.
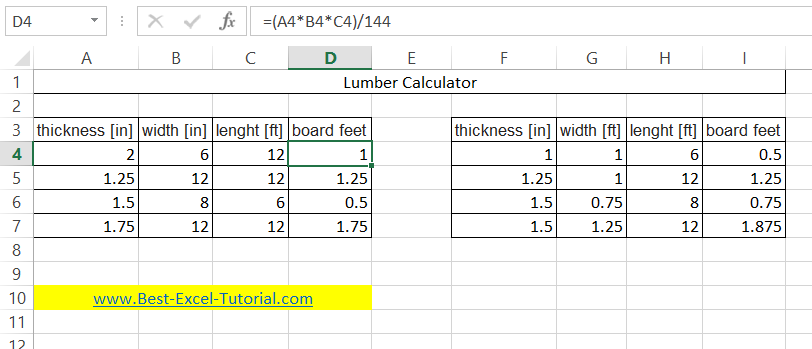
In this Excel lesson, you will teach yourself how to prepare Board Footage Calculator.
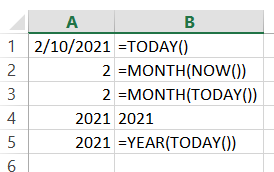
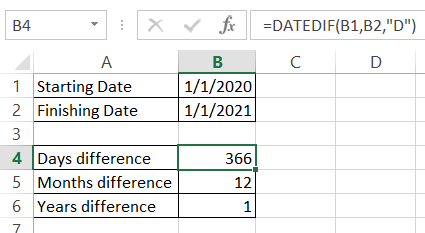
In this Excel tutorial, you learn how to calculate date and days in Excel.
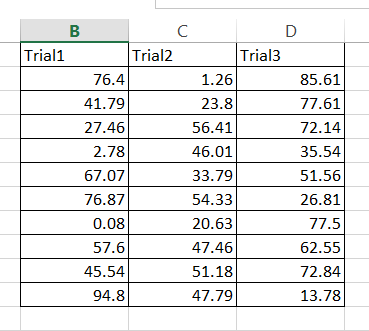
You will learn how to calculate standard error and insert standard error into charts.
The standard error formula is easy to calculate. The only problem is that there is no dedicated Excel function to calculate standard error. Therefore, you need this article to learn how to calculate the standard error step by step and what data you need.
In this Excel tutorial, you will learn how to strikethrough in Excel.