Best Excel Tutorial

Excel Skills Simplified: Tutorials That Actually Work

Interactive Charts data table

How to calculate mode in Excel

The mode represents the most frequently occurring number in any given data set. When you calculate the mode in Excel, you identify which value appears most often in your data. This statistical measure helps you understand data distribution patterns and make informed decisions. To calculate the mode in Excel, you must use dedicated Excel functions. Below, I’ll show you exactly how to do this using simple, step-by-step instructions.

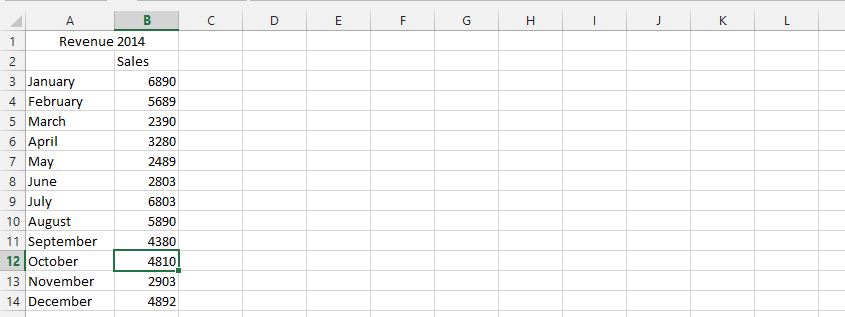
To learn how to calculate the mode in Excel, follow the step-by-step instructions presented below. We will use sample data throughout this tutorial to demonstrate each function. First, open Excel and create a new spreadsheet. Then, enter your data into the cells.

Read More

table data set to calculate the moving average

How to Calculate Rolling Average in Excel

A rolling average is a type of moving average that calculates the average of a set of data points over a specified period. The period can be fixed or variable, and it is typically used to smooth out fluctuations in the data. This technique is particularly valuable in data analysis as it helps identify trends and patterns by reducing noise in datasets. Understanding how to calculate a rolling average in Excel is essential for anyone working with time-series data or analyzing financial trends.

Read More