How to Calculate Probability in Excel
You probably want to know how to calculate probability with Excel. You’ll learn how to calculate probability in Excel using built-in functions like PROB, as well as how to handle more complex scenarios such as dice rolls, coin flips, and poker hands.
PROB function in Excel
You can use the PROB function to calculate the probability in Excel. This function calculates the probability that values in a range fall within a specified range of values.
Syntax of the PROB Function:
PROB (range_x, sample_range, lower_limit, [upper_limit])
- x_range: range of x values.
- prob_range: range of x cells.
- lower_limit: the lower limit of the probability value
- upper_limit: The upper limit of the probability value is set here. This argument is optional.
The PROB function can be used to calculate the probability of values falling within any range, not just a fixed range.
Here are some examples of how to use the PROB function in Excel to calculate probability.
Simple probability example
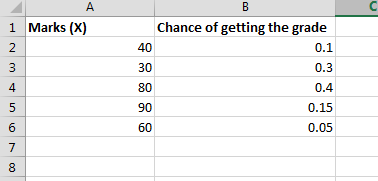
Suppose you want to calculate the probability of a grade falling within a specific range.
Enter data in Excel sheet.

To calculate probability, use the PROB function.

The formula here is =PROB(A2:A10,B2:B10,B13,B14) where
- A2:A10 is range of marks in this example
- B2:B10 is a chance of getting the grade from A column
- B13 is lower range
- B14 stands for upper range
The probability here is 45%.
Calculating Probability for Two Dice Rolls
Let’s check what the probability is for rolling two dice.
I prepared data.

First, I need to calculate the chance of rolling the die.
When rolling two dice, the possible outcomes range from 2 to 12. Some sums occur more frequently than others (e.g., rolling a 7 is more likely than rolling a 2). The roll chance formula is: =COUNTIF($C$4:$H$9,K4)
I used absolute reference in the formula.

There are:
- only one chance to roll 2 and 12
- two chances to roll 3 and 11
- three chances to roll 4 and 10
- four chances to roll 5 and 9
- five chances to roll 6 and 8
- six chances to roll 7
To calculate the probability of 2 dice, you need to divide the number of chances by the sum of chances.
The probability formula for two dice is=$K4/SUM($K$4:$K$14)

Two dice probabilities are from 2.78% to 16.67%.
Based on the above calculations, you can easily calculate what the probability of rolling doubles is.
There are only six chances to do that, so the probability of rolling doubles is 6/36 = 16.67%. The interesting thing is that the probability of rolling doubles is exactly the same as rolling 7.
Calculating Coin Flip Probability
It is 50% to flip the head and 50% to flip the tail. Have you ever wondered what the probability is of flipping the head (or tail) 11 times in a row?
First, let’s calculate the probability of flipping a head once. It is easy. 50%. head or flip.
By translating it to the Excel language, we can create an Excel formula: =POWER(0.5,1)
Further, the probability is equal to =POWER(0.5, number_of_tries).

The probability of flipping a head (or tail) 11 times in a row equals 0.04883%, which is less than 0.05%!
Flipping a head 10 times is 0.09766% probable.
Flipping your head (or tail) 20 times in a row is 0.000095% probable.
We can also look for the possibility of flipping heads (or tails) several times in a row. It’s easy because each time is 2 times less probable.

It’s 1: 2048 odds of flipping a head (or tail) 11 times in a row. It means that every 2048 times you flip a coin, 11 times you flip 11 heads (or tails).
Poker Probability Calculation
It will be fun to analyze the poker probabilities.
First, use the Excel function to check the number of poker combinations. There are 52 cards, from which you get only 5. From a mathematical point of view, it is a simple combination to be used. There is an Excel function COMBIN, for that. Functions take just two arguments as a combination. Simply use the Excel formula =COMBIN(52,5)

It turns out there are 2,598,960 combinations in poker.
To calculate the probability of getting a pair or two pairs, you need to calculate the number of combinations of getting them. And then just divide the two numbers.

The probability is:
- To get a pair 42.26%
- To get two pair 4.75
- For a three of a kind 2.11%
- Straight 0.39%
- Full house 0.2%
- Four of a kind 0.14%
- Four of a kind 0.02%
- Straight flush 0.0014%
- Royal flush 0.000038% (1:649,736 odds)
You can download the spreadsheet in here.


Leave a Reply