Chart with Horizontal Bands in Excel
In this Excel tutorial, you will learn how to create a chart with horizontal bands. Adding horizontal bands can be useful for visualizing thresholds, target zones, or performance levels on a chart.
Excel Skills Simplified: Tutorials That Actually Work
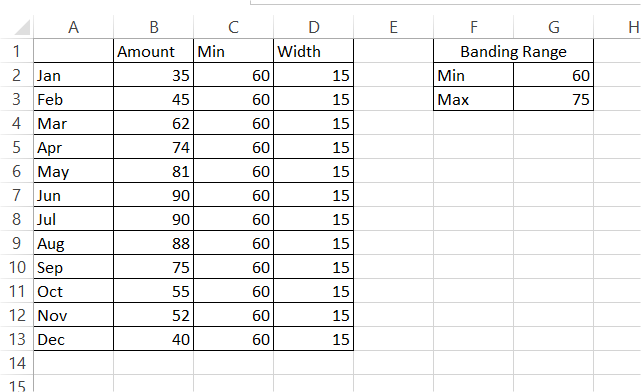
In this Excel tutorial, you will learn how to create a chart with horizontal bands. Adding horizontal bands can be useful for visualizing thresholds, target zones, or performance levels on a chart.
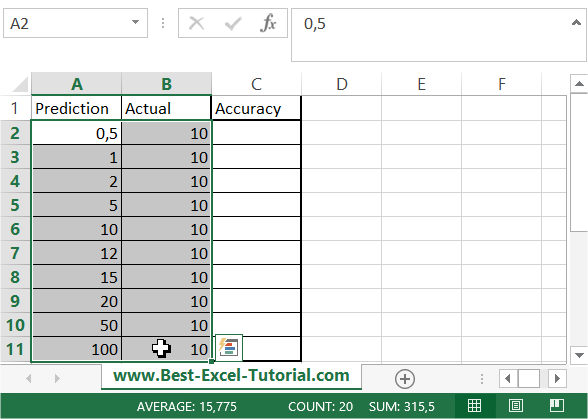
In this Excel tutorial you will teach yourself how to calculate forecast accuracy and precision.
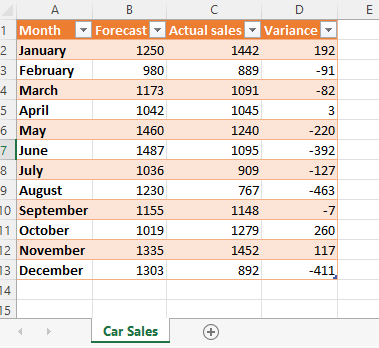
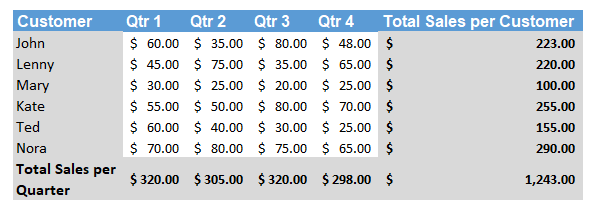
You certainly know how to calculate a variance in Excel. But do you know how to insert variance graphs?
Variance charts in Excel can be used when you wish to compare two sets of data, for example, if you wish to compare the sales forecasts to the actual sales over a period.
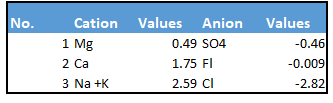
Excel does not have a Stiff Diagram chart option in the charts. But, we can create a Stiff Diagram in Excel by using a scatter chart and a freeform diagram in the shapes tool. Tweaking a bit of the coloring of the chart will give us the perfect Stiff Diagram. Follow these detailed steps to create a stiff diagram in Excel efficiently.
Creating financial scenarios in Excel can help you plan and analyze different outcomes based on different assumptions. Financial scenarios in Excel can be easily created by using what-if analysis in Excel.
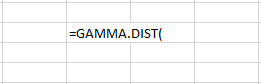
The gamma distribution is a continuous probability distribution used to model a variety of real-life situations, such as the time between events in a Poisson process. In MS Excel, the Gamma distribution can be easily calculated by using the GAMMA.DIST function.
The variance-covariance matrix is a way to describe patterns of data. This statistic can be used as an overview for many multivariate statistical models.
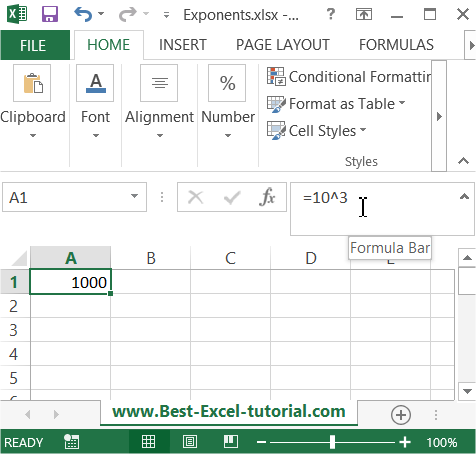
In this Excel lesson, you will learn how to use exponents.
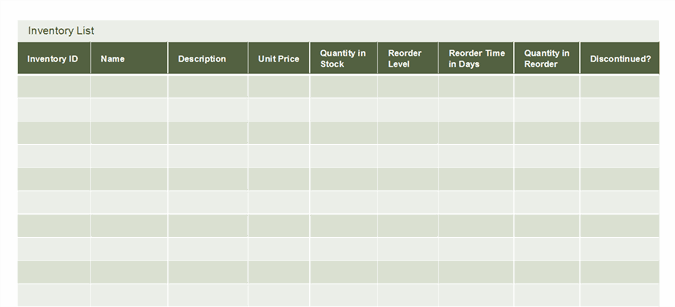
Excel is a great software if you want to take your inventory system or management forward. It’s a great tool for small businesses that automates processes that are usually done by hand.
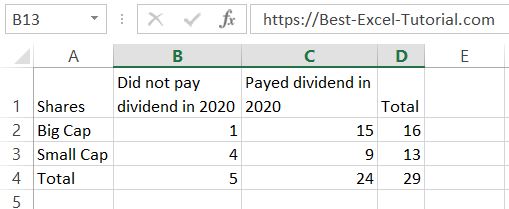
The Chi-Square test is a statistical test used to determine if there is a significant association between two categorical variables. In this Excel tutorial, you will learn how to calculate the Chi-Square test in Excel.