How to Calculate Confidence Interval in Excel?
Excel is a powerful tool for various types of mathematical, engineering and statistical calculations and analyzes. Make the most of Excel’s power!
When preparing a statistical analysis, you usually do not work with data for the entire population. In most cases, you analyze the data calculated for the sample. So in the next step you need to calculate the confidence intervals.
I’ll show you how to do a confidence level analysis and explain how to use the confidence.norm function in Excel.
Table of Contents
What are Confidence Intervals?
The confidence interval for a given statistical measure tells us “how much we can trust a given value”. The confidence interval shows us that the real value is within the specified range with the assumed probability. The confidence interval is closely related to the theory of estimation in statistics.
Take, for example, the study of the mean for a given sample. We calculate the average value for the feature. In this way, by examining the sample mean, we try to determine the value of this feature for the entire population.
In order to estimate the value of a population feature, we establish confidence intervals for the value sought. Based on the sample examination, we can define the boundary ranges. These ranges include the value of the measure with the assumed probability.
Most often, 95% is used as the confidence interval, but another value, such as 99% or 80%, can also be used.
Example of confidence intervals
To illustrate confidence intervals, let’s consider a practical example. A high school teacher wanted to study the growth of students in the high school where he worked (population).
The school, however, was very large, so he decided to measure the students of only one class (samples). On this basis, using statistical knowledge, he determined the height of the students of the entire school.
By measuring the students across the class, he calculated that the average height of the students was 5 feet 5 inches.
This does not mean that this is the average height of all students in the school. Using statistical calculations, he determined the intervals (confidence intervals) and showed that the growth of students with a 95% probability. The true average height of all students throughout the school ranged from 5 feet 2 inches to 5 feet 8 inches.
How the CONFIDENCE.NORM function works?
The Confidence.norm function will allow us to calculate both confidence level and confidence intervals.
Syntax of Confidence.norrm function
=CONFIDENCE.NORM(alpha,standard_dev,size)
- alpha is the significance level that we use to define the confidence level. Alpha is usually 0.05. 95% is the most commonly used confidence level. The alpha is derived from the formula confidence level = 1 – alpha
- standard deviation is what you are able to know from a dedicated standard deviation tutorial
- size is a size of a sample so it is a number of observations you are having in your data set
Calculating confidence intervals in Excel
Calculations using Confidence.Norm function
You know a lot already about the topics. This is the time to try to calculate confidence levels in Excel.
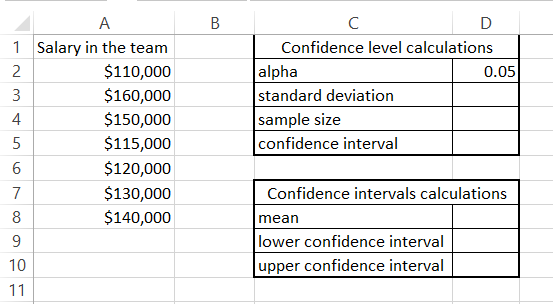
We are curious on what is the confidence level and what are confidence intervals of salaries in our company. The calculation requires having data that looks like this.

First table contains what is needed for confidence level calculations:
- To calculate standard deviation for a sample just use =STDEV.S(A2:A8)
- Sample size is 7 but the formula to calculate it would be =COUNT(A2:A8)
- Confidence interval can be calculated by =CONFIDENCE.NORM(D2,D3,D4)
Having a confidence interval calculated you are able to set confidence intervals. To check confidence levels of a mean do calculate a mean first using the average function.
Based on mean value set confidence lower and upper levels with such a pattern:
- The minimum confidence interval value = mean – confidence interval
- The maximum confidence interval value = mean + confidence interval
In my example I used such a formulas:
- to calculate a mean =AVERAGE(A2:A8)
- Lower confidence interval =D8-D5
- Upper confidence interval =D8+D5

The 95% confidence interval indicates that the true average salary in the company likely falls between $118,307 and $145,978.
Calculations using Analisys Toolpak add-in
It is possible to calculate confidence intervals using Analisys Toolpak add-in.
I have prepared data set of observation values. To calculate it go to the Ribbon > Data > Data Analysis. From the window which pops up pick Descriptive Statistics.

As Input Range choose your data. It is $B$2:$B$11 for me.
An Output Range I would like to set $E$1. You can also choose New Worksheet Ply. I prefer to have it in existing sheet just next to my data set.
Two important things you need to tick are:
- Summary statistics to get summary output
- Confidence Level of Mean and choose the level which is 95% by default

The confidence interval summary table displays all the statistical calculations needed for your data analysis.

Excel calculated:
- mean
- standard error
- median
- mode which is actually not calculated in my case
- standard deviation
- sample variance
- kurtosis
- skewness
- range
- minimum
- maximum
- sum
- count
- confidence level for 95% as set just a minute ago
The Analysis Toolpak returned all of these items, saving you a lot of effort. It has provided some information that may be useful to you. I recommend that you read the other stats articles on my site to become an expert.
Link to a sample spreadsheet is available on my Github account under given link.

Leave a Reply