How to use Analysis ToolPak in Excel
The Analysis ToolPak is an Excel add-in that provides advanced data analysis tools for Excel. To use the Analysis ToolPak in Excel, you need to first install and activate it. By following these steps, you will be able to use Analysis ToolPak add-in.
Configure Add-in
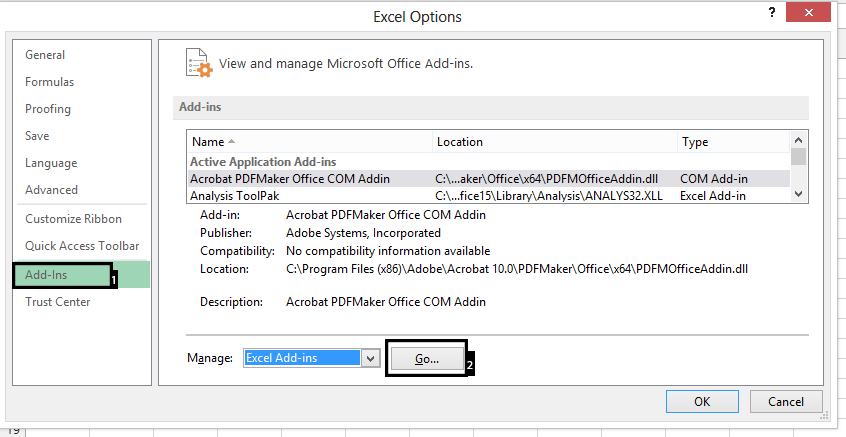
Go to File on top left corner of the Excel. File has green color as a background. Click Add-Ins.

Check Analysis ToolPak.

Once the Analysis ToolPak is installed and activated, you can access its tools from the Data tab on the ribbon. Click Data, and Data Analysis is showing on the right side.

The Analysis ToolPak includes tools for data analysis such as:
- Descriptive Statistics: Calculates basic summary statistics for your data, such as mean, median, mode, standard deviation, etc.
- Correlation: Calculates the correlation coefficient between two sets of data.
- Covariance: Calculates the covariance between two sets of data.
- Histogram: Creates a histogram chart to visualize the distribution of your data.
- Sampling: Performs simple random sampling or systematic sampling on your data.
- Regression: Fits a regression line to your data and calculates the equation of the line.
- Moving Average: Calculates a moving average for your data to smooth out fluctuations.
- Exponential Smoothing: Performs exponential smoothing on your data to smooth out fluctuations.
How to use Analysis ToolPak?
Choose an Data Analysis tool, which is the kind of analysis you would like to make.

Highlight the cells you want to analyze. Choose how you want to group the range. Check the labels in first row and choose an output options.

We have used the tool Analysis ToolPak to do an Anova: Single Factor, which looks like this:


Leave a Reply