How to Calculate Entropy Change in Excel with Examples

Entropy is a measure of disorder in a system. The higher the entropy, the more disordered the system. Entropy change is the difference between the entropy of the initial state and the entropy of the final state.

The entropy change formula is (xij*log2 (xij)). To calculate the entropy change in Excel follow the steps below.

Preparation of the entropy data set

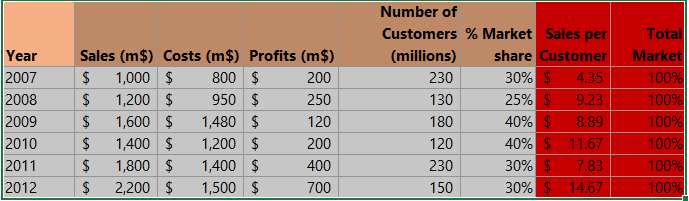
We are going to use dummy data. Suppose you have the following data.

entropy data table

Before calculating the entropy change you first have to find out the sum of each series.

Entropy calculation

Click on Cell A5 and write this formula =SUM (A2:A4). Select cell A and move the cursor to the bottom right of the cell. A black plus sign will appear. Drag the plus sign to cell C5 to copy the formula in this cell.

entropy sum

Now click on cell A6 and write the formula =LOG (A5, 2)

Select Cell A6 and bring your cursor to the bottom right of the cell. A black plus sign will appear. Now drag the black plus sign to Cell C6 to copy the formula in this cell. You have now calculated the entropy change in Excel.

log entropy

Entropy Formula

Here’s another simple formula to calculate entropy in Excel:

=-SUM(A2:A10*LOG2(A2:A10))

Here, A2:A10 represents the range of cells containing the probabilities of each item in the data set. The LOG2 function calculates the logarithm base 2 of each probability, and the SUM function adds up the results. Finally, the result is negated with the minus sign to get the entropy value.

See also  How to calculate Break Even Point?

Note that the probabilities should sum up to 1.0, and all probabilities should be positive values. If your data set contains negative or zero values, you will need to modify the formula accordingly.

Limitations of the Entropy Change Formula

The entropy change formula is a simple and effective way to calculate the change in entropy of a system. However, it has some limitations.

  • The formula assumes that the probabilities of each item in the data set are independent. This is not always the case, and if the probabilities are not independent, the formula may not be accurate.
  • The formula does not take into account the order of the items in the data set. This means that the formula will give the same result for two data sets with the same probabilities, even if the items in the data sets are in different orders.
  • The formula is only applicable to discrete probability distributions. This means that the formula cannot be used to calculate the entropy of a system with continuous probability distributions.

Despite these limitations, the entropy change formula is a useful tool for calculating the change in entropy of a system. It is important to be aware of the limitations of the formula, however, and to use it with caution.

Applications of Entropy Change

Entropy change is a concept that is used in many different fields, including physics, chemistry, biology, and economics. Some of the applications of entropy change include:

  • Calculating the efficiency of a thermodynamic system.
  • Determining the stability of a chemical compound.
  • Understanding the evolution of biological systems.
  • Predicting the behavior of financial markets.
See also  How To Calculate Exponential Integral In Excel

Entropy change is a complex concept, but it is a powerful tool for understanding the world around us. By understanding how entropy change works, we can better understand the behavior of systems at all scales, from the smallest molecules to the largest galaxies.

Key Takeaways

  • Entropy is a measure of disorder in a system.
  • Entropy change is the difference between the entropy of the initial state and the entropy of the final state.
  • The entropy change formula can be used to calculate the change in entropy of a system.
  • The entropy change formula has some limitations, but it is a useful tool for understanding the behavior of systems.