Best Excel Tutorial
Excel Skills Simplified: Tutorials That Actually Work
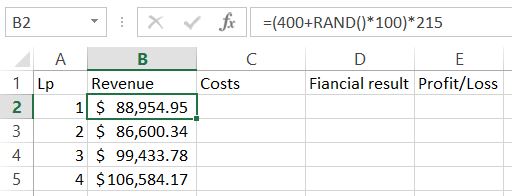
How to Perform Monte Carlo Simulation in Excel: Risk and Profitability Analysis Guide
In this Excel tutorial you will learn how to perform Monte Carlo simulation in Excel to evaluate risk and forecast outcomes. By using Monte Carlo simulation in Excel, you’ll discover how to model uncertainty in financial models, project management, and forecasting with realistic probability-based scenarios.
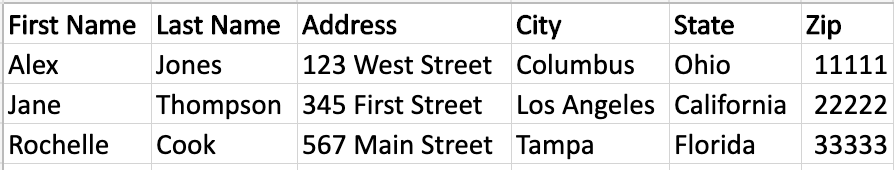
How to Create Mailing Labels from Excel?
When you think of Excel, chances are you first think of lists of data, charts, and tables. While Excel is an excellent spreadsheet tool that allows you to capture and visualize data, it’s also a tool that you can use for other practical purposes in your home or business.
You can create mailing labels from Excel data by using the Mail Merge feature in Microsoft Word. Mail Merge allows you to merge a list of data from an Excel spreadsheet into a set of mailing labels in Word.
How to calculate least squares fit in Excel
Least Squares Fit is a statistical method that is used to find the line of best fit for a set of data points. The line of best fit is a line that is closest to all the data points and is used to predict the value of a dependent variable based on the value of an independent variable. In Microsoft Excel, you can calculate a Least Squares Fit using the LINEST function.
How to Check for Prime Numbers in Excel
In this Excel tutorial, you will learn how to check for prime numbers in Excel using array formulas, MOD functions, and conditional formatting techniques.
How to Calculate MACD Indicator in Excel: Step-by-Step Guide
In this Excel tutorial, you will learn how to calculate the MACD indicator in Excel using exponential moving averages and create trading signals for technical analysis.
The Moving Average Convergence Divergence (MACD) indicator is a popular technical analysis tool used in stock trading and other financial markets to identify potential buy and sell signals. The MACD is calculated as the difference between two moving averages, the 26-day exponential moving average (EMA) and the 12-day EMA, and is often plotted along with a 9-day EMA of the MACD line, known as the signal line.
Here’s how to calculate the MACD indicator in Microsoft Excel:
How to calculate integral average in Excel
In Excel, you can calculate the integral average, also known as a definite integral, by using the Sumproduct function.
Excel can approximate the definite integral of a dataset using the SUMPRODUCT function, implementing the trapezoidal rule. The trapezoidal rule approximates the area under a curve by dividing it into a series of trapezoids, where each trapezoid’s area is determined by the average height of its two vertical sides multiplied by its width.
How to calculate logarithmic average in Excel
Logarithmic average, also known as the geometric mean, can be calculated in Excel by using the geometric mean formula.
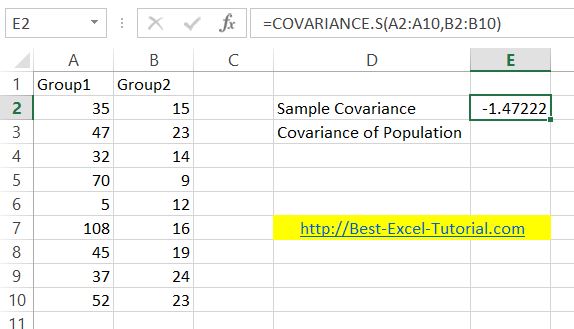
How to calculate covariance in Excel?
In this Excel tutorial, you will learn how to calculate covariance in Excel.
How to use xor function in Excel
The XOR function in Excel is a logical function that allows you to compare two or more values and determine if an odd number of them are true. Learn how to use the XOR function in Excel with practical examples to validate data, check conditions, and improve your spreadsheet logic.