How to fit exponential curve?
In this Excel tutorial, you will learn how to fit an exponential curve.
Excel Functions for exponential curve fitting
Excel supplies two functions for exponential regression, namely GROWTH and LOGEST.
LOGEST is the exponential counterpart to the LINEST function described in Testing the Slope of the Regression Line. We can use the function by entering the array function =LOGEST(R1, R2, TRUE, TRUE), where R1 = the array of observed values for y (not ln y) and R2 is the array of observed values for x, and then press Ctrl-Shft-Enter.
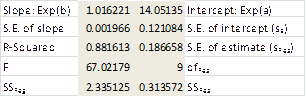
LOGEST doesn’t supply any labels, so you will need to enter these manually. Essentially, LOGEST is simply LINEST using the mapping described above for transforming an exponent model into a linear model. For Example 1 the output for LOGEST(B6:B16, A6:A16, TRUE, TRUE) is as in below figure:
GROWTH is the exponential counterpart to the linear regression function TREND described in Method of Least Squares. For R1 = the array containing the y values of the observed data and R2 = the array containing the x values of the observed data, GROWTH(R1, R2, x) = EXP(a) * EXP(b)^x where EXP(a) and EXP(b) are as defined from the LOGEST output described above (or alternatively from the Regression data analysis). E.g., based on the data from Example 1, we have:
=GROWTH(B6:B16, A6:A16, 26) = 21.35
which is the same result we obtained earlier using the Regression data analysis tool.
Fitting exponential functions to data
GROWTH can also be used to predict more than one value.
In this case, GROWTH(R1, R2, R3) is an array function where R1 and R2 are as described above and R3 is an array of x values. The function returns an array of predicted values for the x values in R3 based on the model determined by the values in R1 and R2.
Observation: Note that GROWTH(R1, R2, R3) = EXP(TREND(R1, R2, LN(R3)))
Using Data Analysis Toolpak
Fitting an exponential curve to data in Excel can be also done using the “Data Analysis ToolPak” and the “Solver” add-ins. Here’s a step-by-step guide on how to fit an exponential curve in Excel:
- The first step in fitting an exponential curve to data is to organize the data in a table. The table should contain two columns: one for the independent variable (x) and one for the dependent variable (y).
- The “Data Analysis ToolPak” is a Microsoft Excel add-in that provides a suite of statistical analysis tools. To install the “Data Analysis ToolPak,” go to the “File” menu, select “Options,” and then select “Add-Ins.” From the “Manage” drop-down menu, select “Excel Add-Ins” and click the “Go” button. Select the “Data Analysis ToolPak” and click the “OK” button.
- The “Solver” add-in is a Microsoft Excel add-in that provides optimization and simulation tools. To install the “Solver” add-in, follow the same steps as installing the “Data Analysis ToolPak.”
- To create a model for the exponential curve, you need to use the “ExpReg” function in the “Data Analysis ToolPak.” To access this function, go to the “Data” tab on the Excel ribbon, and select “Data Analysis.” Select “Exponential Regression” and click the “OK” button.
- Next, input the data into the model. In the “Input Y Range” field, select the column of dependent variable data. In the “Input X Range” field, select the column of independent variable data. In the “Output Range” field, select a location in the worksheet to store the output of the model.
- To fit the exponential curve to the data, click the “OK” button. The “Data Analysis ToolPak” will use the “ExpReg” function to fit the exponential curve to the data and provide the output in the specified location in the worksheet.
- To plot the data and the exponential curve, select the data and the output from the “Data Analysis ToolPak.” Go to the “Insert” tab on the Excel ribbon and select “Scatter Plot.” Select the type of plot that you want, such as “Scatter with Smooth Lines.”
- To adjust the parameters of the exponential curve, you can use the “Solver” add-in. To access the “Solver” add-in, go to the “Data” tab on the Excel ribbon, and select “Analysis.” Select “Solver Parameters” and click the “OK” button. In the “Set Objective” field, enter the cell reference for the exponential curve. In the “By Changing Variable Cells” field, enter the cell references for the parameters of the exponential curve. In the “Subject to the Constraints” field, enter the constraints for the parameters of the exponential curve.
- To solve for the optimal parameters, click the “Solve” button. The “Solver” add-in will adjust the parameters of the exponential curve to fit the data as closely as possible, subject to the constraints.
Using Nonlinear Least Squares Regression analysis
Another method to fit an exponential curve to data in Excel is to use the Nonlinear Least Squares Regression analysis. This method uses a mathematical formula to fit an exponential curve to the data. Here’s how you can use Nonlinear Least Squares Regression in Excel to fit an exponential curve:
- Just like in the previous methods, the first step is to organize the data in a table. The table should contain two columns: one for the independent variable (x) and one for the dependent variable (y).
- In order to use Nonlinear Least Squares Regression, you must have the Analysis ToolPak installed. To install the Analysis ToolPak, go to the “File” menu, select “Options,” and then “Add-Ins.” Select “Excel Add-Ins” from the “Manage” drop-down menu and click “Go.”
- To open the Regression Analysis dialog box, go to the “Data” tab on the Excel ribbon, and click the “Data Analysis” button. Select “Regression” from the list of options and click “OK.”
- In the Regression Analysis dialog box, specify the input range (x) and the output range (y). Make sure to select the “Labels” checkbox if the first row of your data range contains column headings.
- From the list of available models, select “Exponential.”
- Click the “OK” button to fit the exponential curve to the data. The curve will be displayed on a scatter plot along with the data. The coefficients of the curve will be displayed in a separate table.
- To plot the exponential curve, select the data and the curve, and go to the “Insert” tab on the Excel ribbon. Select “Scatter Plot” and choose the type of plot that you want.
Using Solver
Another method to fit an exponential curve in Excel is by using the Solver Add-in. The Solver Add-in is a tool for solving optimization problems, and can be used to fit an exponential curve to data by minimizing the difference between the observed values and the values predicted by the exponential model. Here’s how you can use Solver Add-in to fit an exponential curve in Excel:
- Just like in the previous methods, the first step is to organize the data in a table. The table should contain two columns: one for the independent variable (x) and one for the dependent variable (y).
- In order to use Solver Add-in, you must have it installed. To install Solver Add-in, go to the “File” menu, select “Options,” and then “Add-Ins.” Select “Excel Add-Ins” from the “Manage” drop-down menu and click “Go.”
- In a separate area of the worksheet, define the exponential model that you want to fit to the data. The model should be in the form y = a * e^(bx), where a and b are the coefficients that you want to determine.
- The objective function is a measure of the difference between the observed values and the values predicted by the exponential model. The objective function should be defined in a separate cell and should be expressed as a sum of squares.
- To run Solver Add-in, go to the “Data” tab on the Excel ribbon and select “Solver” from the “Analysis” group. In the Solver Parameters dialog box, specify the Set Objective cell to the cell containing the objective function, and the Changing Variable Cells to the cells containing the coefficients of the exponential model. Select “GRG Nonlinear” as the Solver method and click “Solve.”
- To plot the exponential curve, select the data and the curve, and go to the “Insert” tab on the Excel ribbon. Select “Scatter Plot” and choose the type of plot that you want.
Using Data Analysis tool
Another method to fit an exponential curve in Excel is by using the “Data Analysis” tool. The Data Analysis tool is a feature in Excel that provides a variety of statistical analysis tools, including regression analysis. Here’s how you can use the Data Analysis tool to fit an exponential curve in Excel:
- The first step is to organize the data in a table. The table should contain two columns: one for the independent variable (x) and one for the dependent variable (y).
- In order to use the Data Analysis tool, you must have it installed. To install the Data Analysis tool, go to the “Data” tab on the Excel ribbon, select “Data Analysis,” and then “Data Analysis.” If the Data Analysis tool is not available, you may need to install the “Analysis ToolPak” add-in.
- To run regression analysis, go to the “Data” tab on the Excel ribbon, select “Data Analysis,” and then “Regression.” In the Regression dialog box, specify the Input Y Range as the range of cells containing the dependent variable, and the Input X Range as the range of cells containing the independent variable. Select the exponential regression option.
- Excel will create a new worksheet containing the regression results, including the coefficients of the exponential curve. To plot the exponential curve, select the data and the curve, and go to the “Insert” tab on the Excel ribbon. Select “Scatter Plot” and choose the type of plot that you want.
In conclusion, there are several methods for fitting an exponential curve in Excel, including the Data Analysis tool, manual curve fitting, and the Solver Add-in. Each method has its own strengths and limitations, and the best method to use depends on the specific data and the level of expertise of the user.
The Data Analysis tool provides a quick and simple way to fit an exponential curve, but it may not provide the most accurate results for all data sets. Manual curve fitting is a more flexible and powerful method, but it requires more time and expertise to set up. The Solver Add-in provides a powerful optimization tool that can be used to fit an exponential curve, but it requires more setup and understanding of the optimization process.
Regardless of the method used, it is important to carefully assess the results of the exponential curve fit to ensure that it accurately represents the underlying data. This can be done by comparing the observed and predicted values, plotting the curve and the data, and using statistical measures to evaluate the goodness of fit.
Leave a Reply