How to calculate t value in Excel
In this Excel tutorial lesson, we’ll explore a valuable statistical concept, T-Value, and how to calculate it using Microsoft Excel.
Understanding the T-Value
A T-Value is a statistical calculation using the mean, standard deviation, and degrees of freedom. This t‑value calculation helps you build more accurate financial projections and forecasts.
With this information, a business owner can calculate the statistical low and high for earnings in a specific month and with a degree of confidence that the future earnings will fall within that range, which helps with better business planning. Projections might suggest that the business can expect to gross $150,000 in May and the T-Value might tell them that number has a 90-percent rate of confidence. If the confidence rate is less than 50-percent, the business can plan for the potential of a lower return and work to increase the T-Value for future months and years.
The syntax
Now let’s see how to calculate the t value with a simple Excel formula:
The Formula =T.DIST(x,deg_freedom,tails)
The T.DIST function uses the following arguments:
- X (required argument) – This is the numeric value at which we wish to evaluate the T Distribution.
- Deg_freedom (required argument) – An integer that indicates the number of degrees of freedom.
- Tails (required argument) – Specifies the number of tails for the distribution (1 for a one-tailed test, 2 for a two-tailed test).
Data
First, create the input data for the calculation:
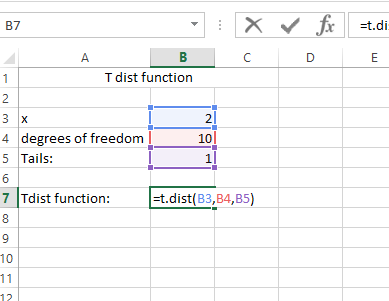
T.DIST function
- x: 2
- degrees of freedom: 10
- Tails: 1
The T.DIST formula
Apply the formula in Excel as shown below:
=T.DIST(B3,B4,B5)

The result is:

The T dist function result is 0.963306. This means that the probability of obtaining a T-value of 2 or greater in a one-tailed test with 10 degrees of freedom is approximately 96.33%.
Using the T.INV Function
To calculate the t-value in Microsoft Excel, you can also use the T.INV function. The T.INV function calculates the one-tailed probability of the t-distribution. The function has two arguments:
- Probability (p): The probability associated with the t-distribution. This argument must be between 0 and 1, exclusive.
- Degrees of freedom (df): The number of degrees of freedom in the t-distribution. This argument must be greater than 0.
Example:
To calculate the t-value with a probability of 0.025 and degrees of freedom of 10, you would enter the following formula in a cell in Excel:
=T.INV(0.025, 10)
This formula returns the critical T-value for a one-tailed distribution with a 2.5% significance level and 10 degrees of freedom.
This would return the t-value of -1.83311293. This result represents the critical T-value for a one-tailed distribution with a 2.5% significance level and 10 degrees of freedom. It is used to determine the cut-off point beyond which the test results would be considered statistically significant.
Summary
T.DIST is useful for finding the probability associated with a given T-value.
T.INV helps find the T-value corresponding to a specific probability.
Both functions are essential for performing statistical analysis in Excel, especially for hypothesis testing and financial forecasting.


vott
It solved my issues!!!