Best Excel Tutorial
Excel Skills Simplified: Tutorials That Actually Work
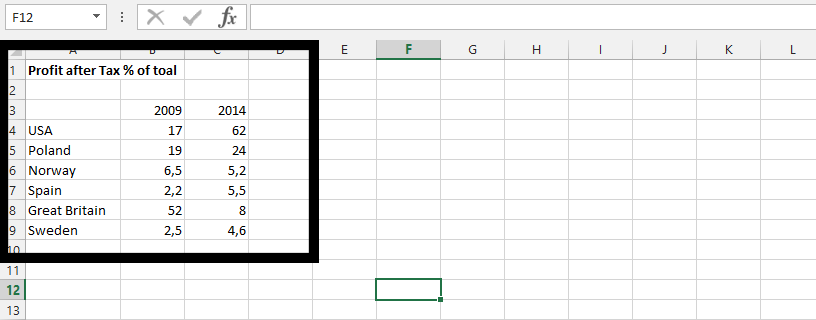
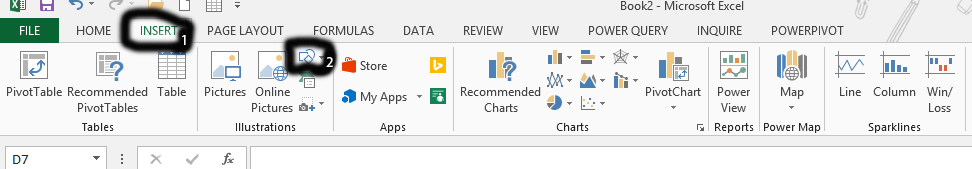
How to Insert Chart Title from Cell?
Inserting chart title from a cell in Excel can easily be done, and we are going to do it together. In this Excel tutorial you will teach yourself how to insert dynamic chart title from the cell.
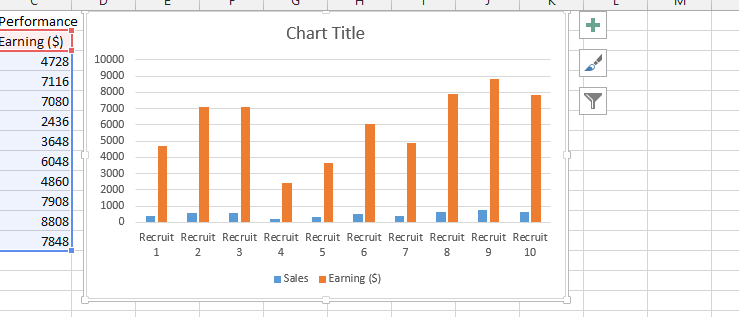
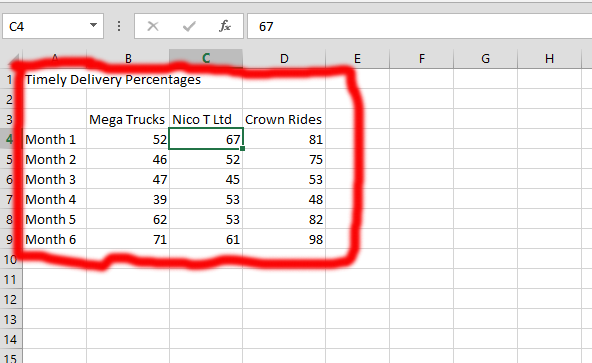
How to Overlay Graphs in Excel
Overlay graphs are a powerful tool for data visualization. They allow you to compare multiple data series on the same graph, which can help you to identify trends and patterns that would be difficult to see if the data was presented in separate graphs.
In this Excel tutorial, you learn how to overlay graphs in Excel. We will also discuss the benefits of using overlay graphs and some tips for creating effective overlay graphs.
How to Make a Kite Chart in Excel
Kite charts are unique graphs that display changes in species abundance or data distribution along a measured line often used in ecological studies and field surveys.
Unlike standard charts, a kite chart reveals how values rise or fall at specific locations, making it easy to visualize patterns across a habitat or transect.
In this step-by-step tutorial, you’ll learn exactly how to create a kite chart in Excel, so you can effectively present and analyze your survey or environmental data.
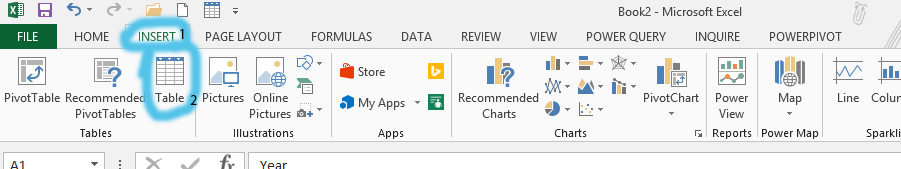
How to Make a Flow Chart in Excel
Learn how to make a flow chart in Excel to organize and visualize your business processes, workflows, and decision trees in a clear and professional manner. Creating a flowchart in Excel is easier than you might think and provides an excellent way to document and improve your workflow efficiency.
Age Population Pyramid in Excel
An age population pyramid chart in Excel visualizes how many people exist at specific ages and their gender distribution. This pyramid chart in Excel shows males and females separately. Creating this pyramid chart in Excel is straightforward. Follow this simple step-by-step guide to build your age population chart.
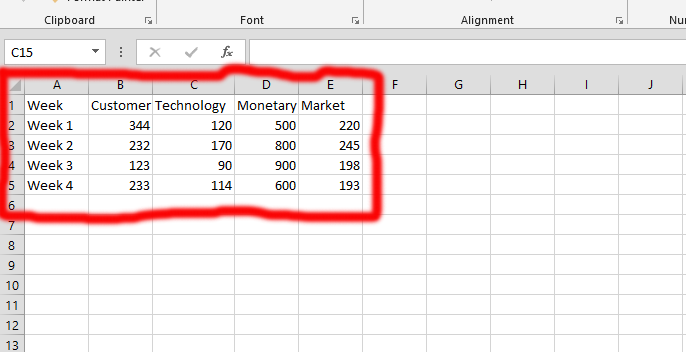
How to Create a Polar Chart in Excel: Step-by-Step Guide
Creating a polar chart in Excel can be a great way to visualize cyclical data, like percentages over time. In this comprehensive Excel tutorial on polar chart creation, you will learn step-by-step how to make and design a polar chart.
How to insert Panel Chart in Excel
The panel chart is a set of similar charts that have been aligned neatly in the panel. The chart also has other names like trellis displays or small multiples. Its goal is to help the audience to understand some data that contains different variables.
It makes it a lot easier to structure segment of the document that the author is explaining to the audience.
How to Create an Interactive Map Dashboard in Excel
The interactive map is a useful application for vendors, marketers, and consumers. It is a web based map with clickable points. When clicking one of the points, it shows informational box relevant to that point. It is usually charts or other relevant data. It is not only great at performing a promotional data of a location. But, it also have the ability to keep audiences engaged.
The interactive map chart in Excel is all about deciding what the map should show. It is best to make sure that the data is something that could be layout in the map. Together, we will create an interactive map dashboard from the beginning to the end Let’s assume that you do not have the necessary resources to do the interactive map dashboard. We should start fresh.