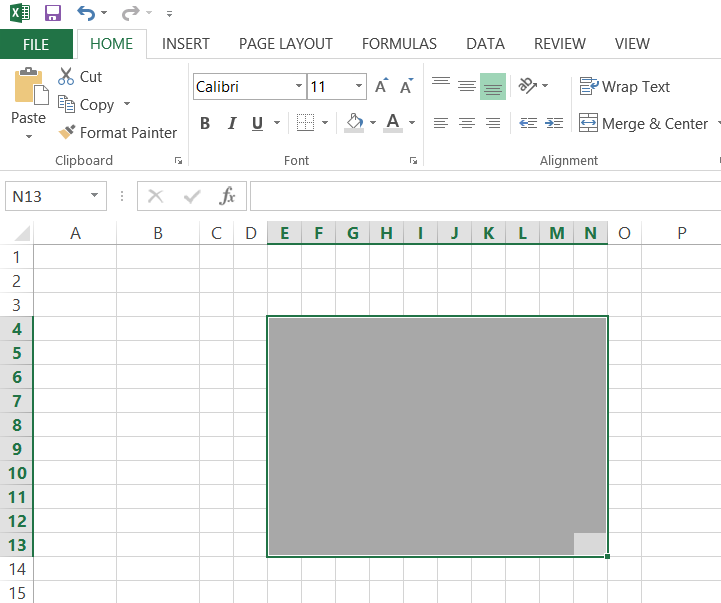
Waffle chart
In this lesson, you learn how to insert a Waffle Chart in Excel. Waffle Chart is a good choice for Power Point presentations.
The Largest Excel Knowledge Base ✅ The Best Place to Learn Excel Online ❤️
In this lesson, you learn how to insert a Waffle Chart in Excel. Waffle Chart is a good choice for Power Point presentations.
In this Excel charting tutorial lesson, you will learn how to insert a chart with a scrollbar in Excel application. This kind of chart could be useful for more complicated data sets.
This is quite an interesting kind of chart in this Excel tutorial. Here you learn how to create floating bars and put them into your chart.
This time you will teach yourself how to group data in your chart. The Excel tutorial may be useful for preparing consolidated chart for report or some kind of summary.
In this Excel charting tutorial, you will learn how to create a chart with baseline. You may need that for reports or checking filling the targets (eg. targets of production or sales).
In this Excel tutorial, you will learn one easy trick. You will learn how to change the color of the markers on your chart. You may need this to customize your chart to highlight specific data points.
In Microsoft Excel, you can create charts with multiple series to display multiple sets of data on the same chart and compare their values. This Excel tutorial will teach you how to handle that situation.
A difference chart, also known as a change chart or a delta chart, is a type of chart that shows the difference between two data sets over time (e.g. month, quarter). The difference chart is used to highlight the changes in the data sets, making it easier to visualize trends and patterns in the data.
In this Excel tutorial, you can learn how to insert Difference chart into your spreadsheet.
Are you responsible for preparing periodic reports? Does your company need you to create quarter reports? This Excel tutorial is perfect for you. Teach yourself here how to insert time series graphs in Excel.
In this Excel tutorial, you will learn how to insert a chart with your data and the goal line that was expected. This kind of chart is best for sales/production reports or business plans for the company you want to establish.