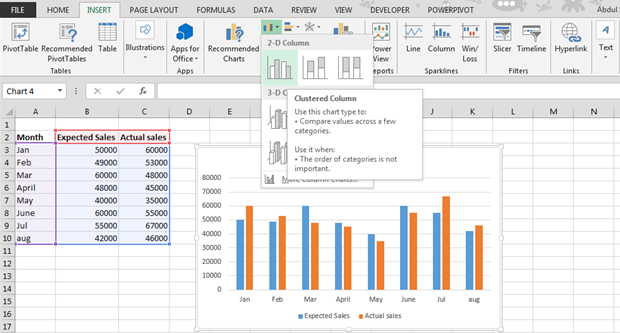
Chart with multiple series
Learn how to create a chart with multiple series in Excel to compare and visualize multiple datasets on the same chart. This comprehensive tutorial teaches you how to create multi-series charts, organize data effectively, and display multiple series side by side for better data analysis and comparison.