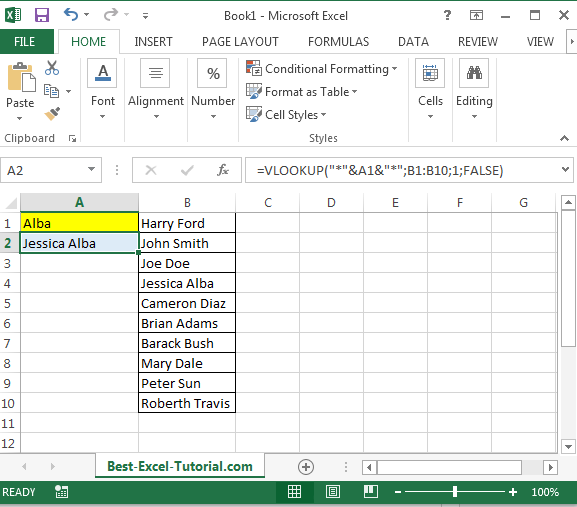
How to do a Vlookup Using Text
In this Excel tutorial, you learn how to vlookup using string of text. This is a simple trick you will understand and use many times in Excel.
Excel Skills Simplified: Tutorials That Actually Work
In this Excel tutorial, you learn how to vlookup using string of text. This is a simple trick you will understand and use many times in Excel.
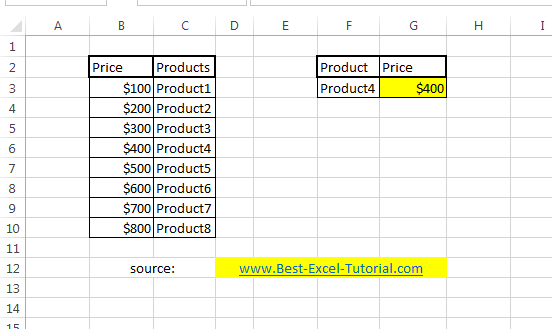
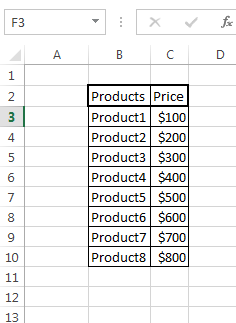
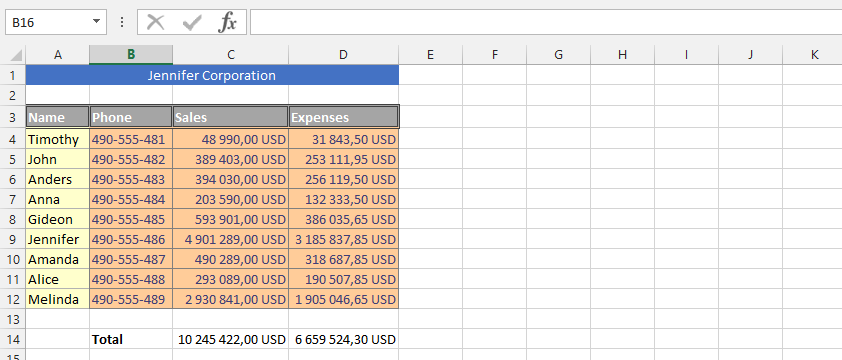
Something tricky today. Let’s create some backwards VLOOKUP formula. It’s quite easy, but not obvious. Here’s an example.
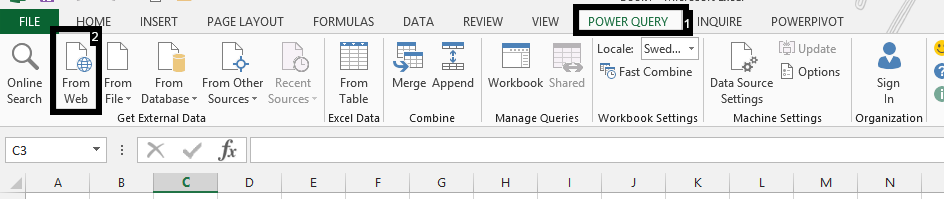
Let’s expand your drop-down list using this simple trick in Excel. Teach yourself here how to automatically load the values into the drop-down list using VLOOKUP function.
A powerful spreadsheet tailored for forex trading can be crafted using various methods. This tutorial article guides you through one effective approach to build such a spreadsheet.
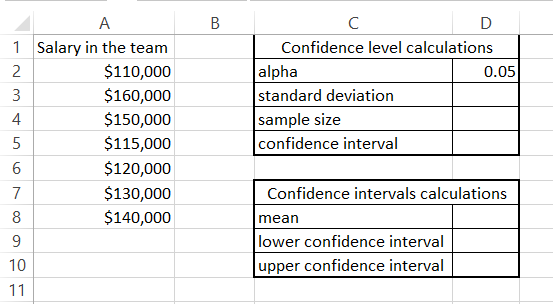
Excel is a powerful tool for various types of mathematical, engineering and statistical calculations and analyzes. Make the most of Excel’s power!
The special characters in Excel can be understood in different ways. How to deal with it when using it depends on the person using it.
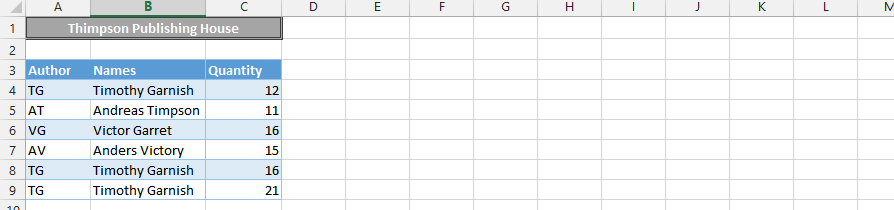
In Excel, you can perform a many-to-many lookup to find multiple values based on a single criterion. This is useful for tasks such as finding all the books that a certain author has written for a specific publisher, or all the products that a certain customer has bought from a specific store.
We will show you how to perform a many-to-many lookup in Excel using different functions and formulas.
Learn how to increment row number in Excel formulas using ROW() and OFFSET() functions. This comprehensive tutorial teaches you how to create dynamic formulas that automatically adjust and increment row ranges. Master the techniques to increment row numbers for more flexible and powerful Excel calculations.
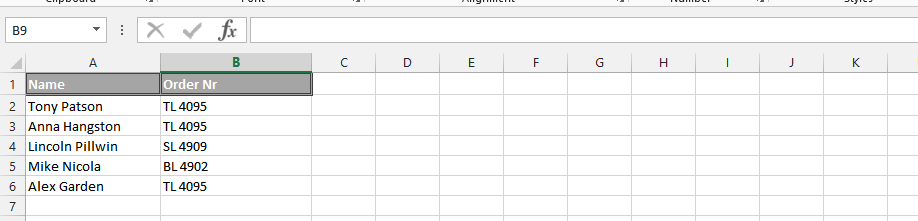
In this Excel tutorial, you will learn how to do a vlookup with multiple criteria in Excel.