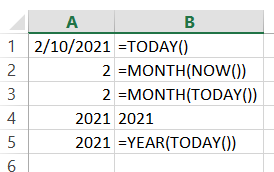
Date and Days calculations in Excel
In this Excel tutorial, you learn how to calculate date and days in Excel.
Excel Skills Simplified: Tutorials That Actually Work
In this Excel tutorial, you learn how to calculate date and days in Excel.
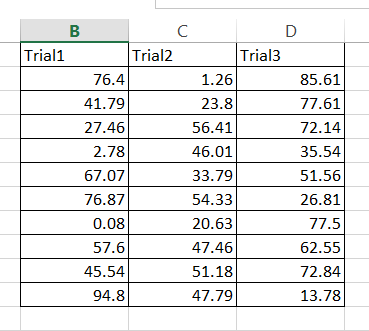
You will learn how to calculate standard error and insert standard error into charts.
The standard error formula is easy to calculate. The only problem is that there is no dedicated Excel function to calculate standard error. Therefore, you need this article to learn how to calculate the standard error step by step and what data you need.
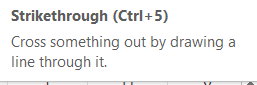
In this Excel tutorial, you will learn how to strikethrough in Excel.
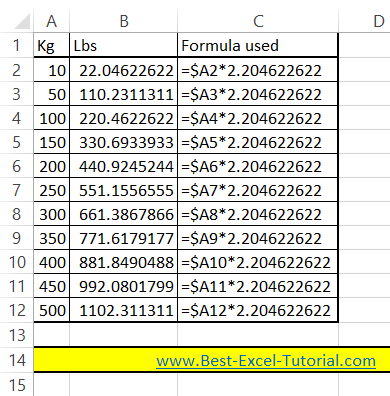
In this Excel tutorial lesson, you learn how to convert kg to lbs (pounds) and lbs to kg using the Microsoft Excel application.
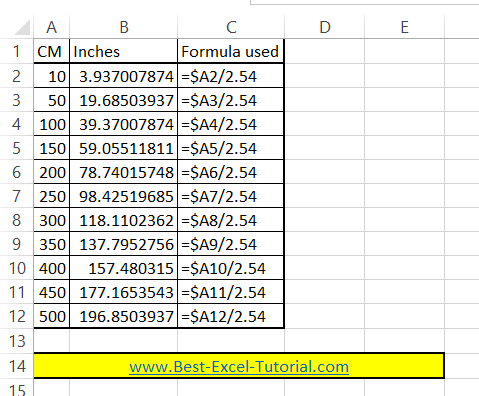
In this Excel tutorial lesson, you will learn how to convert cm to inches, cm to feet and inches and inches to cm using the Microsoft Excel application.
Shuffling data in Excel is a critical task for randomizing lists for sampling, scheduling, or bias prevention. This guide shows you how to shuffle and randomize data effectively using various Excel methods and functions.
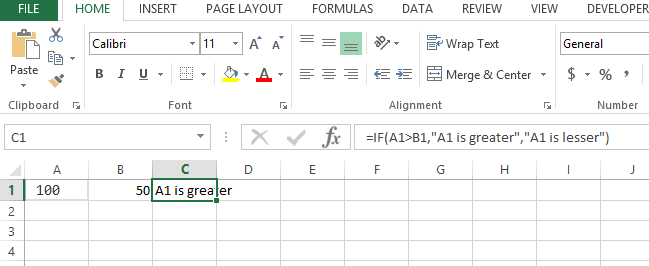
In this article, I will guide you to write simple if functions as well as the complex if functions with multiple conditions or we also call it nested if functions.
Lets start with simple if function in Excel formulas:
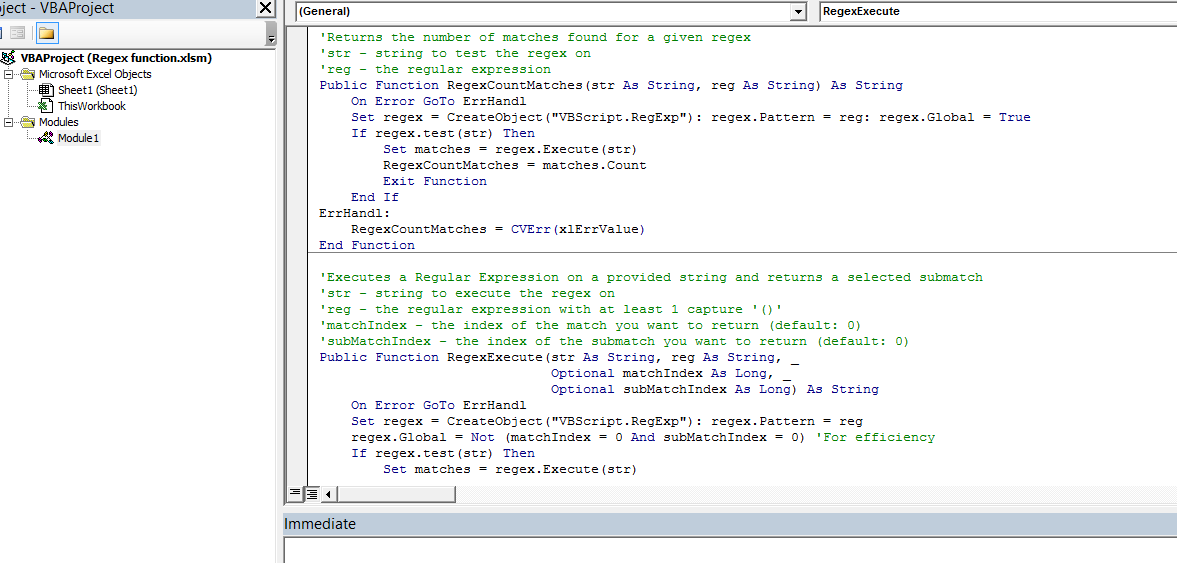
In this article we will learn to use Regex in Excel.