How to Calculate Beta of a Stock in Excel: Complete Guide
Stock beta is a measurement of the risk of a particular stock relative to the risk of the entire stock market, and learning how to calculate beta of a stock in Excel is an essential skill for investors. Before choosing a particular stock for your portfolio, you can use this stock beta calculation in Excel to decide how risky it is.
Though beta is not the only factor to consider before investing in a stock, you can make a wise decision by considering beta as well.
What is a beta?
Beta is defined as follows:
β = Covariance(rs, rb)/Variance(rb) where
rs is the return on the stock, and rb is the return on a benchmark index. You can choose the benchmark index as you wish.
If the beta of a particular stock is one, then that stock has the same risk as the market. If the beta value is greater than one, then that particular stock is riskier than its benchmark and vice versa.
Let us calculate Apple Inc’s beta in relation to the S&P 500 benchmark index.
Calculate Stock Beta
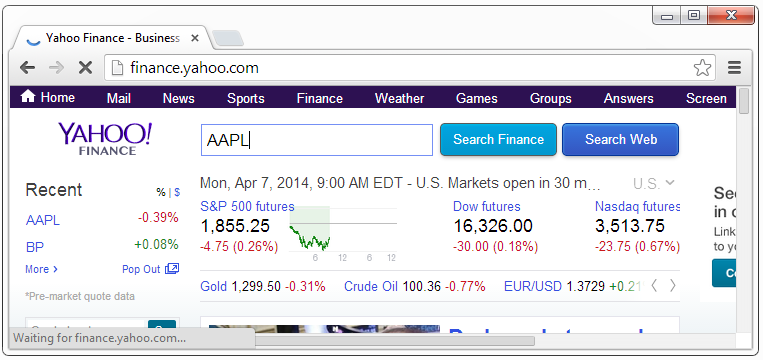
Step 1. Go to any of the reliable finance sites and download the historical data for the period you want. Here I am getting the monthly data for Apple Inc (AAPL) from September 1st, 2010 to April 7th, 2014 from finance.yahoo.com. Visit the site finance.yahoo.com and in the Search Finance textbox, type AAPL like this:

Click the Search Finance button. Then, click on Historical Prices from the left-side menu (circled in red).

Step 2. In the Start Date: combo box, set the values to September 1, 2010 and change the frequency to monthly. Now your screen will look like this:

Click the “Get Prices” button. Scroll down to the bottom and you will find a link to download a spreadsheet like this:

Click the link and a .csv file will be downloaded to your computer. Open the file and the data will be seen like this:

Step 3: Visit https://research.stlouisfed.org/fred2/series/SP500/downloaddata to obtain the S&P 500 index between September 1, 2010 and April 7, 2014.
Choose Monthly from the Frequency drop down and enter 2010-09-01 into the Date Range textbox. Now your screen will look like this:

Click the Download Data button and an Excel file will be downloaded to your computer. If you open the file, your screen will look like this:

Step 4. Open Excel and save your file as beta.xlsx. Type “Apple Inc. (AAPL)” in A1, “Date” in A3, “AAPL” in B3, “S&P 500” in C3, “AAPL %” in D3, and “S&P 500 %” in E3. You can format these cells and make them bold. Now your screen will look like this:

Step 5. Open the .csv file which contains the historical data of AAPL stock. Copy the values in the column named Date (cells A2 to A45) and paste them into the cells A4 to A47 of beta.xlsx.
Step 6. Copy the data in the column named Adj Close (cells G2 to G45) from the .csv file. Paste the data into the cells B4 to B47 of beta.xlsx.
Step 7. Open the Excel file that contains the S&P 500 index data. If you analyze the data, you will find that it is given in ascending order, starting from 01-09-2010 to 01-04-2014.
We have to sort the data in descending order so that we can copy the data easily. Select the data (cells from A19 to B63). Go to Home (main menu) –> Sort & Filter (from the Editing group) and click Sort Newest to Oldest.

You may notice that the data is sorted in descending order by date.
Step 8: Copy the data from B20 to B63 and paste it into the beta.xlsx spreadsheet’s cells C4 to C47. Now your screen will look like this:

Step 9. To calculate the percentage return, click inside the cell D4. Enter =(B4-B5)/B5. Click inside the cell E4 and enter =(C4-C5)/C5.
Step 10. Copy the formula in cell D4 and paste it in the cells from D5 to D47, and copy the formula in cell E4 and paste it in the cells from E5 to E47. Now your screen will look like this:

Change the value in the cells C4, D47, and E47 to 0 as #NA will create problems when we create beta value.
Step 11. Type “Numerator” in H1, “Denominator” in H2 and “Beta” in H3. Click inside the cell I1. Go to Formulas (main menu) –> More Functions (from the Function Library) –> Statistical and select the COVARIANCE.P function.

You will get a new window like this:

Enter D4:D47 in the Array1 textbox and enter E4:E47 in the Array2 textbox. Click OK.
Step 12. Click inside cell I2. Go to Formulas (in the main menu) –> More Functions (from the Function Library) –> Statistical and select the VAR.P function.

You will get a window like this:

Enter E4:E47 in the Number 1 textbox and click OK.
Step 13. Click inside the cell I3 and enter the formula =I1/I2. You can cross-check the beta value using the SLOPE formula as well. Click inside the cell J3 and enter the formula =SLOPE(D4:D47,E4:E47)
You could find that both the formulas give the same result.
As per the calculation, the beta value of AAPL stock is .0397, which is very low. This indicates that AAPL’s stock price does not vary significantly even if the S&P swings up and down.

Leave a Reply