
Best Excel Tutorial
Excel Skills Simplified: Tutorials That Actually Work


How to Make a Bar Chart
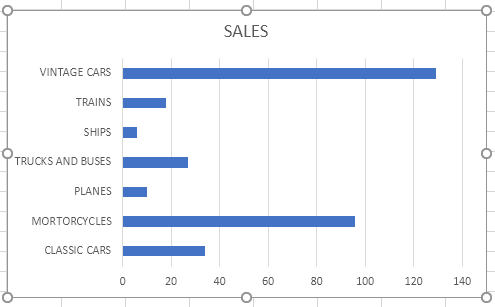
Every Excel tutorial needs to contain how to make a bar chart lesson. Bar charts are one of the simplest ways to represent a collection of data. Also, creating a bar chart is just a matter of a few clicks in Excel.
This is an ultimate guide to cover up creating and formatting bar charts, types of bar charts and its limitations.

How to Open XSD Files in Excel (with Images)
Today something about XML in Excel. We will learn how to use XSD files in the Excel application.
XML is a markup language that is used to store and transport data. Excel can be used to open and work with XSD files, which are XML Schema Definition files.
In this article, we will show you how to open XSD files in Excel.
How to create Excel file in PHP
Generating Excel files from PHP is a common requirement for web applications. Fortunately, there are libraries like PhpSpreadsheet that simplify this task. PhpSpreadsheet is a popular library for creating and managing Excel files in PHP. Here’s a step-by-step guide on how to create a basic Excel file using PhpSpreadsheet:

How to Make a Venn Diagram in Excel
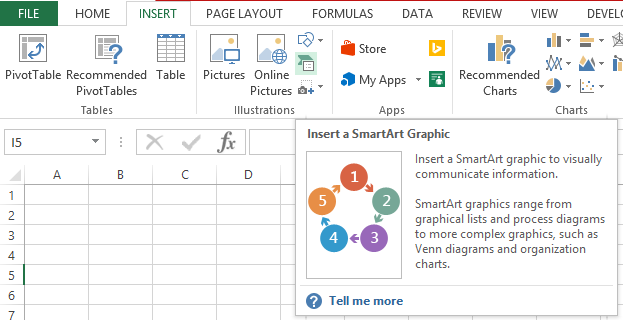
Venn diagrams are powerful tools for visualizing relationships and overlaps in your data. Excel makes it surprisingly easy to create them! Follow the steps below to create a Venn Diagram.

What is Watch Window in Excel
The Watch Window in Microsoft Excel is a feature that allows you to monitor the values of cells while you work in a different part of the workbook. The Watch Window is particularly useful when you are working with large, complex spreadsheets, and you need to keep an eye on the values of specific cells. With the Watch Window, you can track the values of cells without having to scroll back and forth between different parts of the worksheet.
Here is how to use Watch Window in Excel.

Multiple Loops in Excel Vba
In this article, we are going to learn how to use multiple loops in VBA. Two commonly used loops in VBA are the For loop and the For Each loop. We are going to use the For Next Loop first.

How to Define a Custom Number Format in Excel
In Excel, you can define custom number formats to display numbers in a specific way. This can be useful for formatting currency, percentages, dates, and times.
You will learn how to define a custom number format in Excel. You will also learn about the most commonly used codes for custom number formats.

How to Adjust Margins in Excel
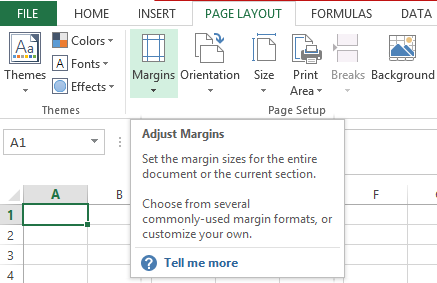
Margins are the blank spaces around the edges of a printed page. They can be adjusted to fit your needs, such as the size of your worksheet or the printer you are using.

How to Create Fibonacci Sequence in Excel
This is an Excel tutorial on how to make Fibonacci numbers form a sequence. After two starting numbers, the next number in the sequence is the sum of the two preceding numbers.