Best Excel Tutorial
Excel Skills Simplified: Tutorials That Actually Work
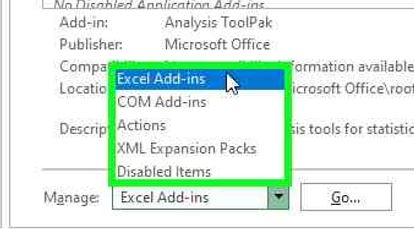
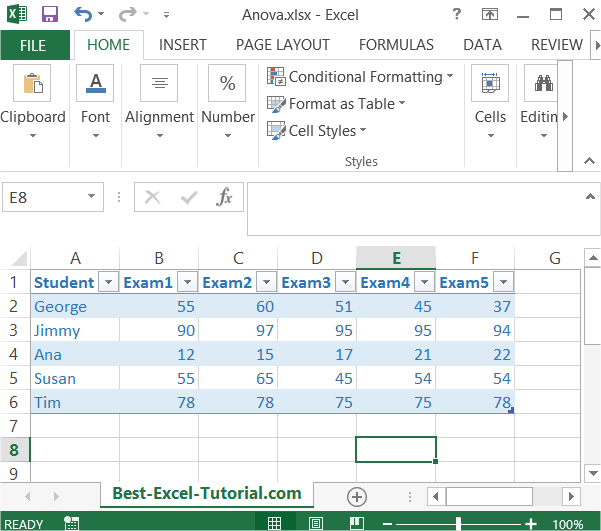
How To Calculate Variation Ratio Test (aka. F-Ratio test)
The Variation Ratio test, also known as the F-Ratio test, is a statistical method used to compare the variances of two samples drawn from different populations. This test helps you determine whether the variations (or spreads) of two samples are statistically equal. Understanding and applying this test is essential for statistical analysis work in Excel.
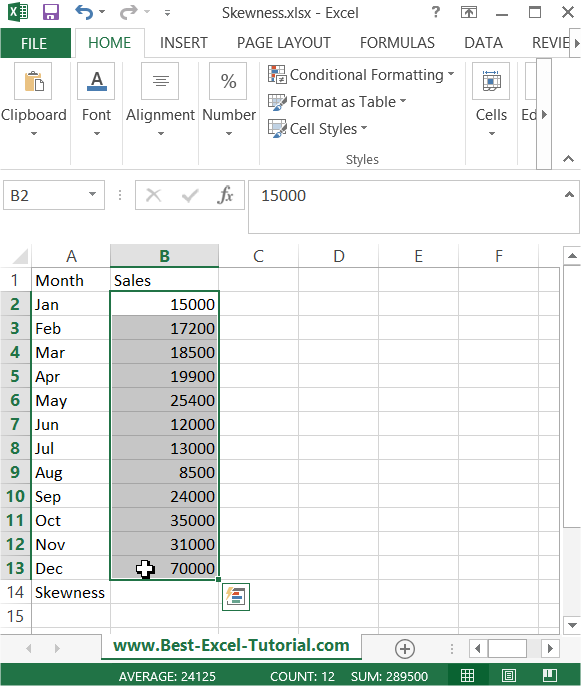
How to Calculate Skewness in Excel
In this Excel tutorial lesson, you will learn what skewness is and how to calculate skewness in Excel application.

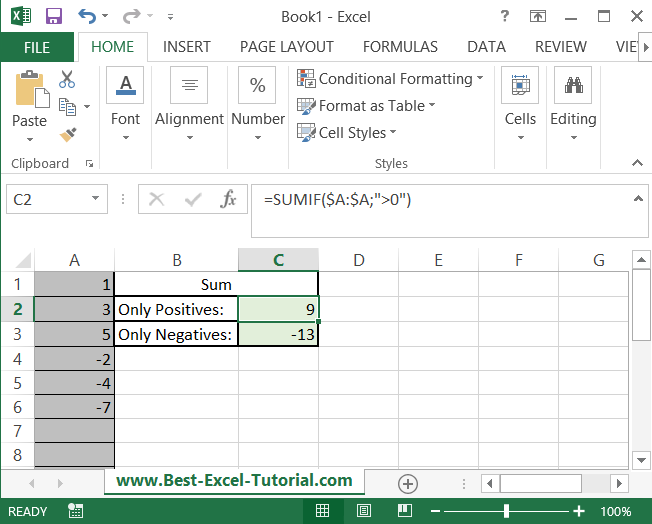
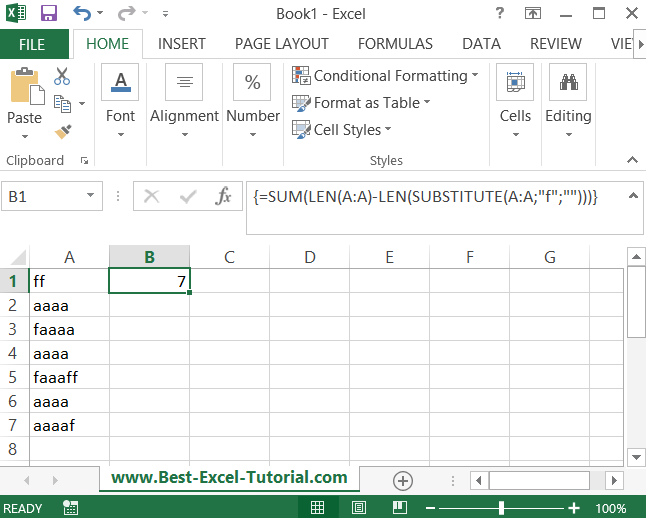
Counting occurrences of a character in a spreadsheet
In this Excel tutorial you will teach yourself how to count occurences of a character in a spreadsheet.
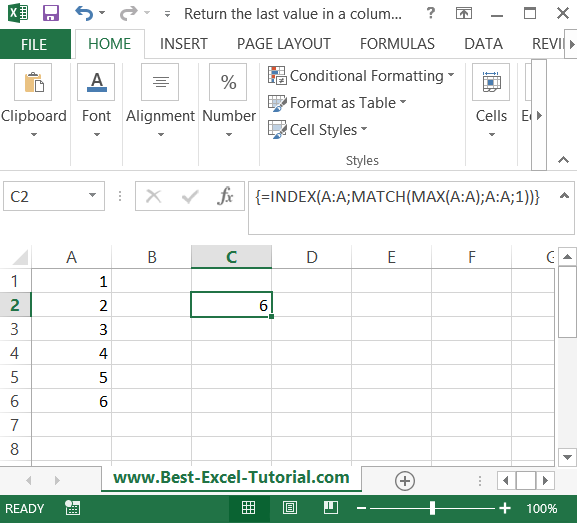
Return the last value in a column
In this Excel tutorial, you will learn how to create a formula which returns the last value in a column.
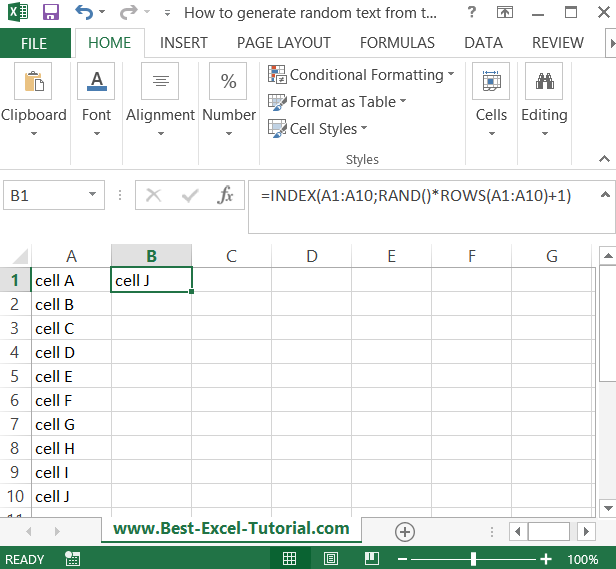
How to generate random text from the list?
In this Excel tutorial, you learn how to generate random text from a list.
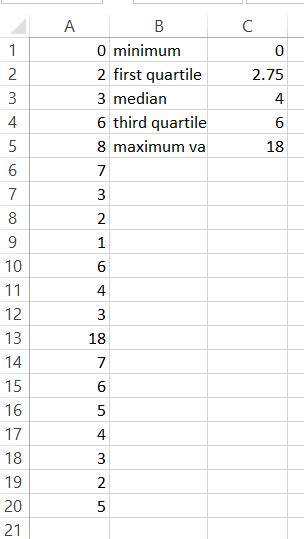
How to Calculate Quartiles in Excel
Quartiles are statistical values that divide a sorted data set into four equal parts, with each quartile representing a specific percentile. This Excel tutorial will guide you through calculating quartiles using the QUARTILE.INC function.
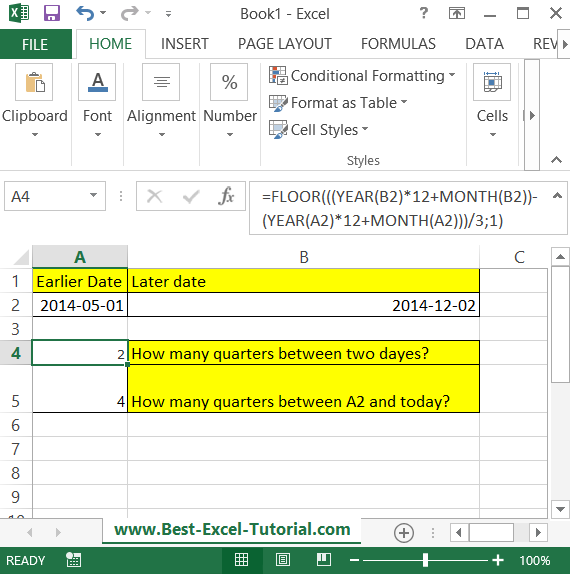
Count of quarters between dates
In this Excel tutorial lesson, you will learn how to calculate the count of quarters between two dates using the Excel application.