How to Use Linest Function in Excel
The Linest function helps you figure out statistics for a single line in your data. It does this by using something called “least squares” to find a straight line that matches your data closely.
Then, it gives you a set of numbers that describe that line. It does all this by taking data you put into the Linest formula and giving you back the results in an array.
Linest Formula Parameters
The Linest formula consists of four different components which are known_ys, known_xs, const, and stats.
- Known_ys: This is a required part of the formula. The set of its values that are already known in the relation, meaning y = mx + b. If the term component happens to be a single column, then any column in the one in known_xs will be interpreted as a variable that is seperately.
- Known_xs: This is an optional part of the formula. There is a set of x values that you may already know are related, which means y = mx + b. This is a range that can contain one or more sets of different variables.
- If only one variable is used, both known_ys and _xs can be any shape. But this only happens if they both have the same range. If it happens that more than one variable is used, known_ys must be viewed as a column vector, but only if range is a row or column vector.
- If this element known_xs is omitted, it will be automatically created as an array with the same size as the previous component (known_xs).
- Const: This is optional. This is a boolean value that will determine where or not to force the constant b to be 0. If set to true or omitted, b will be evaluated normally. If set to false then b will be set to 0, which will cause the values of m to be corrected to match the condition where y = mx.
- Stats: This is optional. This is a Boolean value that will determine whether to return the additional regression statistics. If set to true, linest will return this statistic. If set to false or even omitted, it will only return the coefficients m and the constant b.
Examples of Linest formulas
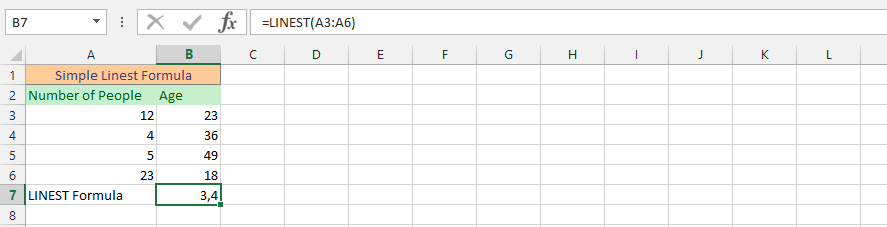
Example 1: Simple linest formula
We need to find statistics on the number of people that were available with the linest formula. This example is about the simplest linest formula.

Example 2: Advanced linest formula
I need statistics on the number of people broken down by age. This example gives you the opportunity to find a better answer. We will use the full linest formula to get the statistical information we are aiming for, and we will use the same data we used in the previous example.

Example 3: Simultaneous SUM and LINEST formulas
The business goes to a certain level because we have completed a certain sale that we have already set for ourselves for the year. However, we want to make some adjustments to estimate how much sales we might achieve in the coming month. We have become more ambitious in our business, so we need to check whether the valuation is achievable. Our estimate is 15,000.
This is where the sum and linest formula is used to help us determine if the goal is achievable.

Example 4: Linest formula with Text
In this example, we have our data layout, and it is very important that we use text instead of cells, as we have already marked them appropriately.

Example 5: Average yield using the Linest formula
This example is great for informing you that in circumstances where you have already set yourself an average goal that you should give every six weeks. We also need to use the mean formula in conjunction with the linest formula to get the statistical value of the mean performance.

Example 6: Using both the XOR and the Linest formula
We have set a specific goal for the business and we want to know if it is true or false. Therefore, we use the formulas xor and linest at the same time to find out if it is true or false.

Example 7: Simultaneous MMULT and LINEST formulas
In this example, we need a value and statistical value matrix for the output. To find the simultaneous value, we’ll use both the MMULT formula and the linest formula.

Example 8: The simultaneous usage of SUMPRODUCT and LINEST formulas
In this example, we’re using the same data as the previous one, but this time we’re using both sum and linear formulas to find the answer that we missed for a while.
This will allow us to properly evaluate the input data and see the differences in the pattern.

Example 9: Linest in another spreadsheet file
The example is to find a statistical value using a formula row that has been placed in another spreadsheet. This allows us to be more flexible in the details we provide in circumstances that may require some changes in the future.

Example 10: What about using the data in another document?
We will use the same data as the previous ones, but this time we will use it on a different document. The idea is to judge if it gives the same result as in the previous example and gives you the opportunity to see if it is very possible to use a linear formula using data from other data.


Leave a Reply