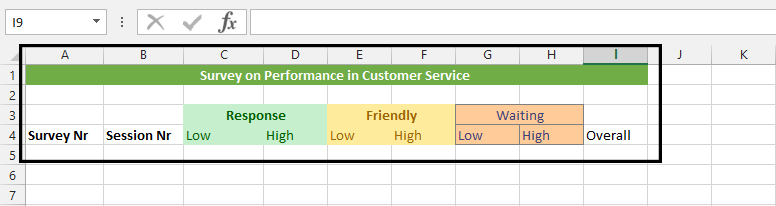
How to Summarize Survey Results in Excel
In this Excel tutorial, you will learn how to create survey and summarize survey results in Excel.
Excel Skills Simplified: Tutorials That Actually Work
In this Excel tutorial, you will learn how to create survey and summarize survey results in Excel.
In this Excel tutorial article, you will learn how to convert an Excel spreadsheet into an online database. What is an online database? It is a database that can be accessed by computers anywhere in the world.
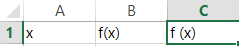
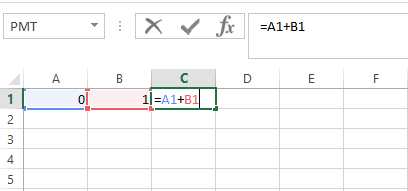
The Newton-Raphson method is a numerical method used to find the roots of an equation, i.e., the values of x that make the equation equal to zero. It is a powerful tool for solving complex non-linear equations, and it can be implemented in Excel using a combination of the “Goal Seek” function and a user-defined function.
The Newton-Raphson method is based on the idea of iteratively improving an estimate of the root, based on the tangent line to the curve of the equation at the current estimate. The method starts with an initial guess for the root, and then calculates a new estimate.
Follow the steps below to learn how to use Newton Raphson Method in Excel.
This is an Excel tutorial on how to make Fibonacci numbers form a sequence. After two starting numbers, the next number in the sequence is the sum of the two preceding numbers.
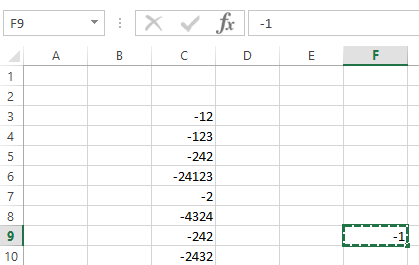
The steps below shows how to convert a negative number to a positive number.
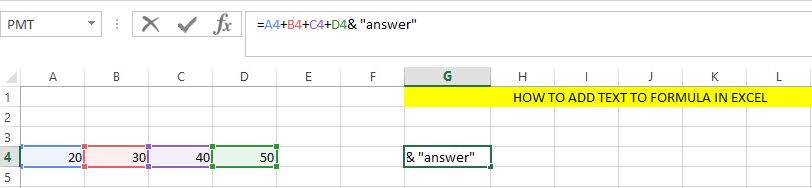
When working with data in Excel, you may often need to combine text and numbers in a single cell. This can be done using the ampersand (&) or the TEXT() function.
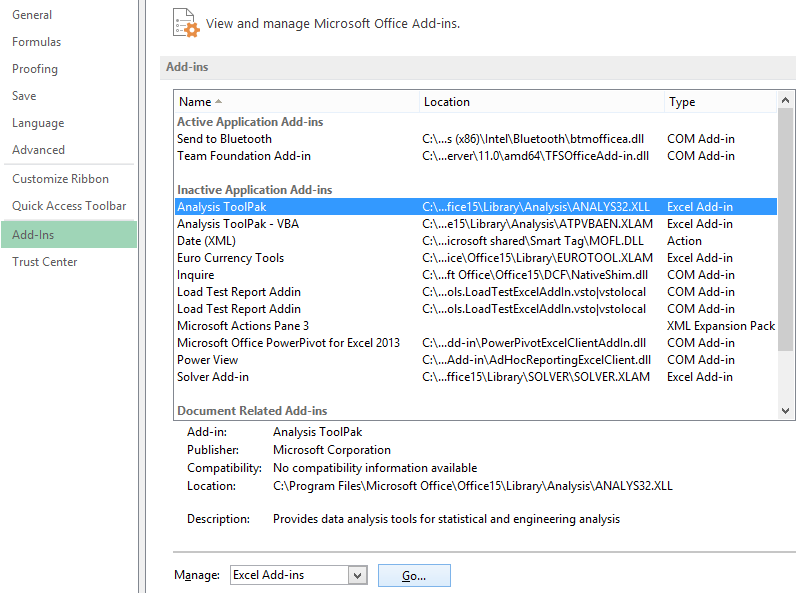
Excel contains a data analysis add-in that allows to to perform a Fourier analysis of a series of numbers. Follow these detailed steps below to execute Fourier analysis in Excel successfully.

Learn how to work with milliseconds in Excel and master the art of displaying time in milliseconds format. If you care about precision and need to handle milliseconds of time formatting in Excel, this comprehensive guide shows you exactly how to display milliseconds in your spreadsheet using custom number formatting and formulas.
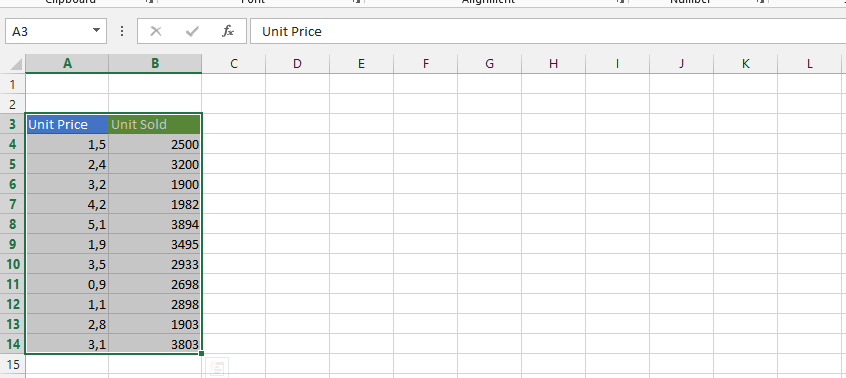
The vlookup function can easily help you determine if a value that is in one column is in another.
There are times when you need to get data from another sheet in Excel. Learning how to pull data from another sheet is a fundamental Excel skill. This comprehensive guide will show you how to retrieve data using VLOOKUP formulas, INDEX/MATCH functions, cell references, and 3D formulas. Whether you’re working with multiple sheets or workbooks, we’ll help you master pulling and referencing data from another sheet efficiently.