How to loop without using VBA or macros?
Looping is a fundamental concept in Excel, and it can be done using VBA or macros. However, there are also ways to loop in Excel without using VBA or macros.
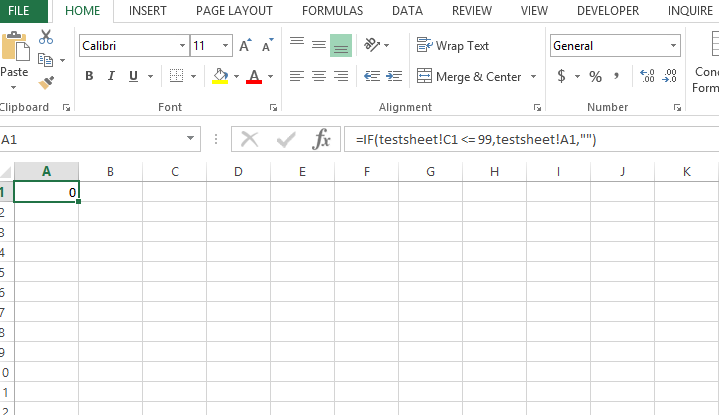
We will show you how to loop in Excel using the IF function and the INDEX function.