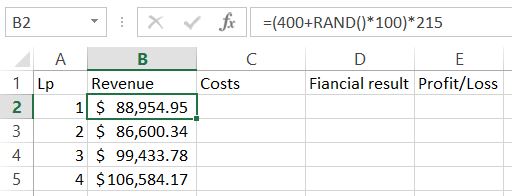
How to insert a Treemap in Excel?
A treemap chart is a chart that displays hierarchical, tree-structured, data using nested rectangles.
Excel Skills Simplified: Tutorials That Actually Work

A treemap chart is a chart that displays hierarchical, tree-structured, data using nested rectangles.
In this Excel tutorial, you’ll discover how to perform a comprehensive three-factor ANOVA in Excel and master statistical analysis of multiple factors.
ANOVA (Analysis of Variance) is a powerful statistical method for analyzing complex datasets, allowing you to examine how multiple factors simultaneously impact your data. By using the three-factor ANOVA in Excel with the Data Analysis Toolpak, you can efficiently evaluate factor interactions and main effects.

A blood alcohol calculator in Excel can be a useful tool for determining the estimated blood alcohol content (BAC) of an individual based on their weight, gender, the number of drinks consumed, and the time elapsed since their last drink. Here is a step-by-step guide for creating a blood alcohol calculator in Excel:
The QBI deduction is a tax benefit for self-employed and small-business owners who have pass-through income. It allows them to deduct up to 20% of their qualified business income (QBI) from their taxable income. QBI is the net profit of a business, excluding certain items such as capital gains, dividends, interest income, and wages.

In this Excel tutorial, you will learn how to calculate p value in Excel.

In this Excel tutorial, you will learn how to subtract.

In this lesson, you will learn how to calculate ROE in Excel.