Best Excel Tutorial
Excel Skills Simplified: Tutorials That Actually Work
How to open a dbf file in Excel
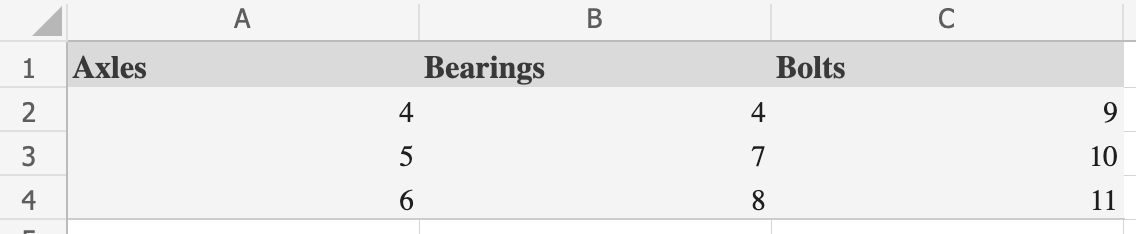
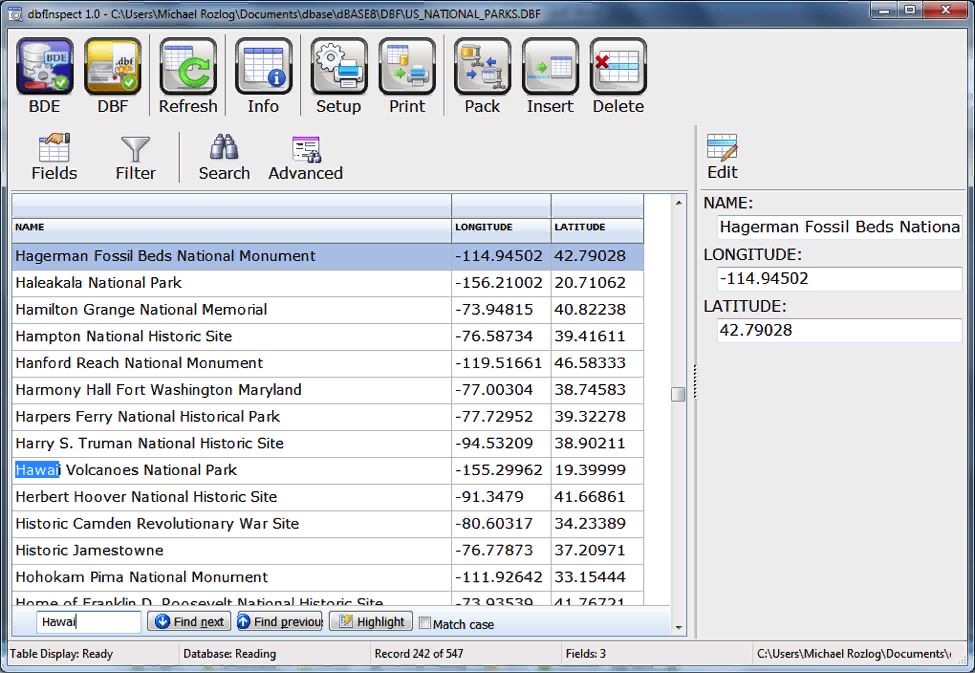
DBF file is a Database file extension that is used by the data management system dBase. The data that is in the file is stored within a series of various records and fields. It was made for small businesses, that’s why it’s so simple and straightforward. DBF files were used in one of the first data management programs and software.
How to Open XLB Files in Excel: A Step-by-Step Recovery Guide for Data and Custom Tools
In this Excel tutorial, you’ll learn how to open, recover and convert XLB files in a way that matches what real users actually need: getting their work back, moving custom toolbars between computers, and understanding what this strange file type really is.
How to VLOOKUP Zip Codes?
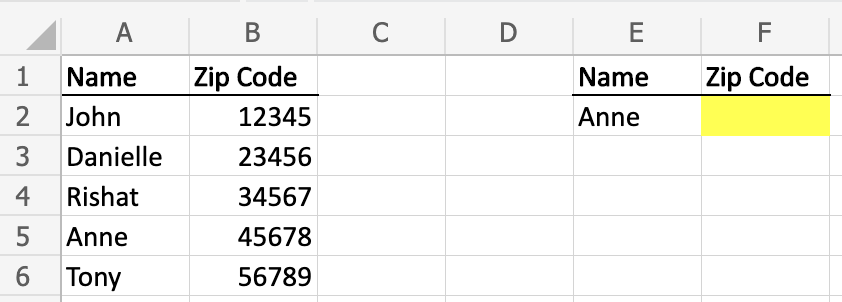
Whether for a school project or a work assignment, chances are you’re going to need to use VLOOKUP at least once in your life. Let’s say you have a long list of names, contact information, and addresses, including zip codes.
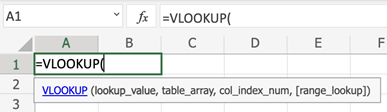
You need to pull the zip codes for a targeted subset of contacts on the list, but looking up each contact individually is time consuming. Fortunately, VLOOKUP can help you quickly pull zip codes for any sized list of contacts. Let’s take a look how to VLOOKUP zip codes.
How to Use VLOOKUP in Excel to Keep Formatting Consistent
When you use the VLOOKUP function in Excel, the formatting of the lookup value or the lookup result may change depending on the format of the source data.
Why Does VLOOKUP Give Me the Wrong Value?
VLOOKUP is one of the most powerful and easily accessible Excel formulas available. Capable of quickly scanning thousands of rows to almost immediately pull the desired information into a new cell, VLOOKUP should be in every Excel user’s arsenal. If you’re not familiar with the VLOOKUP formula, it can often feel intimidating, especially if you’ve run across your first real need to use it.
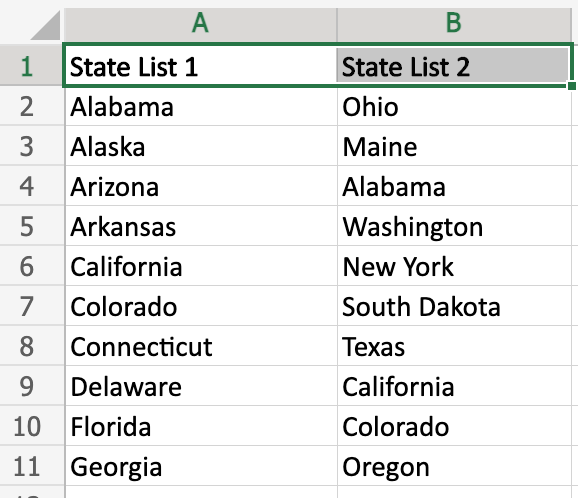
How to VLOOKUP Another Column
Working with large sets of data can often be intimidating. There may be times when you need to identify one column of data compared to another, either to quickly identify which values are missing, or to pull out specific cells. So how do you do that without manually reviewing each cell? The answer – Vlookup.
How to Vlookup other Tab in Excel?
Excel’s VLOOKUP is a powerful feature. It finds and retrieves data from one tab to another. This guide breaks down the process into easy steps. It makes data management efficient.
How to Vlookup Using Dates in Excel
Using VLOOKUP with dates in Excel enables you to search for a specific date within a table and return the associated value, making date-based VLOOKUP lookups essential for data analysis. This technique works similarly to standard VLOOKUP functions but specializes in using dates as the lookup value to find matching records. Here’s how to perform VLOOKUP with dates in Excel step-by-step: