Exponential Integral Excel: Complete Guide with Examples
Exponential integral is a function used to calculate the displacement of data along an exponential distribution.
We can use this function to determine the rate of growth or decline of variables. For example, an online business owner can use this to calculate the growth rate of sales on their site.
To create an Exponential Integral function, you will need the source data. In our scenario the sales figures by day for the online store.
For the purposes of this guide sample data has been created for you to use in the scenario listed above.
Table of Contents
Steps to create an Exponential Integral function
The steps below will take you through the process using sample data. A quick reference guide is available at the end of this document.
Open sample spreadsheet How To Calculate Exponential Integral In Excel sample data.
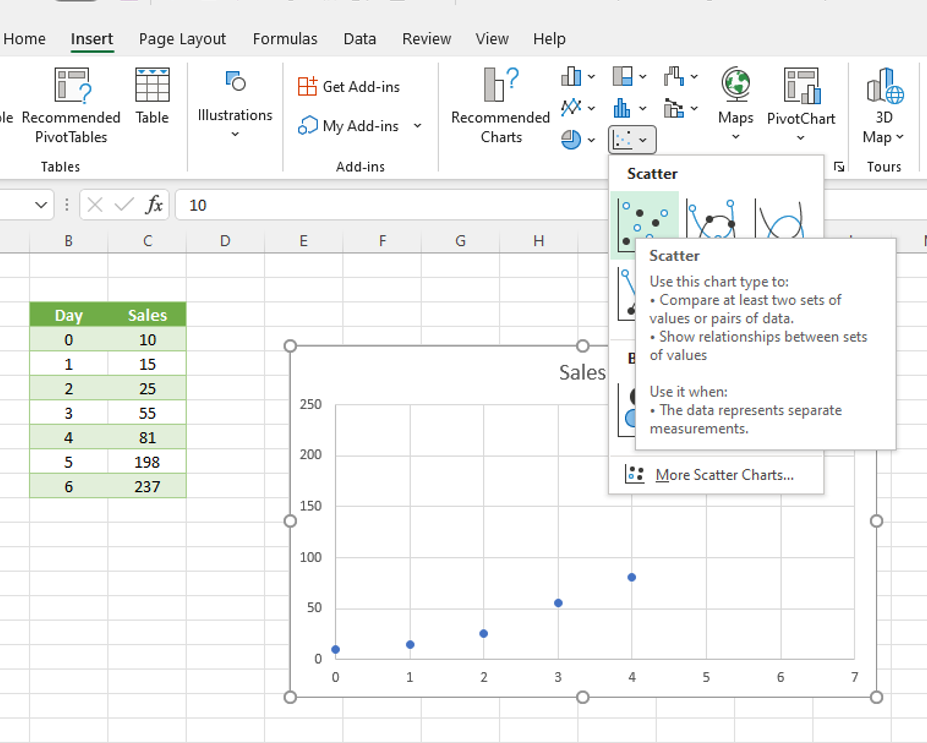
Click in any cell within the table. On the menu click Insert, in the Charts group, click the Scatter chart icon, choose the Scatter option (the first listing).

Excel generates a scatter chart. Click on the chart, then click the + plus sign on the right of the chart, tick Axis Titles, text boxes appear.

Enter Days in the text box of the X axis across the bottom, and Sales by day in the Y axis label, along the left.

Right-click on any of the data points on the chart, click Add Trendline.

The Format Trendline pane opens to your right.

Under Trendline Options select Exponential.

Stay within the pane, scroll down, and select Display Equation on chart and Display R-squared value on chart. The equations appear on the chart.

Calculating The Growth Factor and Growth Rate
We will use the EXP function and the exponent (the number in the top right of the equation on the chart) to calculate the growth factor. Exponent = 0.5654 in this scenario.
In an empty cell type =EXP(0.5654), press enter.

Excel displays the growth factor – 1.76015, subtract 1 from the factor to get the growth rate of 0.76015.
Forecasting With The Exponential Integral
We can use the growth factor and the initial amount, the y value from the chart, to forecast the sales figures for a given number of days. Initial amount (Y) = 9.1723 in this scenario.
In cell E11 enter 7, in the sales cell to the right enter this formula =9.1723*(1.76015)^E11, press enter.

The result is at 10 days the online store can expect 2618 sales (rounded down).

Forecasting With The Format Trendline pane
We can use the Format Trendline pane, Forecast area to chart periods forwards from the current end point of the chart, or backwards from the beginning.
Right-click on any of the data points on the chart, the Format Trendline pane opens.

Scroll down to Forecast, in Forward, type 2, press Excel calculates 2 periods into the future and updates the chart.

Quick reference guide
Steps to create an Exponential Integral function
- Open spreadsheet containing your data.
- Click in any cell within the table. On the menu click Insert, in the Charts group, click the Scatter chart icon, choose the Scatter option.
- Excel generates a scatter chart. Click on the chart, then click the + (plus sign) on the right of the chart, tick Axis Titles, text boxes appear.
- Type the name for your X axis title across the bottom; type your Y axis title along the left.
- Right-click on any of the data points on the chart, click Add Trendline.
- The Format Trendline pane opens to your right.
- Under Trendline Options select Exponential.
- Stay within the pane, scroll down, and select Display Equation on chart and Display R-squared value on chart. The equations appear on the chart.
Calculating The Growth Factor and Growth Rate
We will use the EXP function and the exponent (the number in the top right of the equation on the chart with an ‘x’ at the end) to calculate the growth factor.
- In an empty cell type =EXP(exponent value), press enter.
- Excel displays the growth factor, subtract 1 from the factor to get the growth rate.
Forecasting With The Exponential Integral
We can use the growth factor and the initial amount, the y value from the chart, to forecast the sales figures for a given number of days.
- In the cell beneath your last period/interval make an entry for the next period. g., if your table runs to 6 days, enter 7 in the last row, in the cell to the right enter this formula =initial amoun*(1.growth factor)^enter the cell address for the new period/interval you entered, press enter.
- The result appears, round the result if appropriate, that is, the variable is the amount of visitors, whole numbers are appropriate.
Forecasting With The Format Trendline pane
We can use the Format Trendline pane, Forecast area to chart periods forwards from the current end point of the chart, or backwards from the beginning.
- Right-click on any of the data points on the chart, the Format Trendline pane opens.
- Scroll down to Forecast, in Forward, type the number of interval periods you want to forecast, press enter.


Leave a Reply