How to Make Logarithmic Scale in Excel
In this Excel tutorial lesson, you will learn what a logarithmic scale is and how to use it with charts.
Table of Contents
Why to use a logarithmic scale?
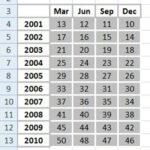
Sometimes it happens that the data in the chart is contained within a large range. In this case, the individual values are significantly different from each other, deteriorating chart transparency. The smallest values are invisible. I will show you how to solve this situation. For log scale purposes, I prepared a sample table of sales data.

See how to create a chart in the case where the data in the graph differs significantly from each other. You must first insert a chart. Let’s insert a column chart.

How to create a chart with a logarithmic scale?
As you can see, it is completely unreadable. Two of the products’ sales are so large that you can’t see the other columns. Log scales would solve the problem of visibility. So you need to format the data series. Right-click on the data series and choose Format Axis.

A dialog box appears. Check the Logarithmic scale check box and set the Base to 10.

See how this time it will look like your column chart. Take a look at the scale of Axis.

When using a logarithmic scale, it is an easy to read chart. Clearly, you see all the bars are significantly different from each other’s numerical values.
At the end of the lesson, a little theory. Look at the scale of the data in the chart. A logarithmic scale means that each additional level of data is greater than 10 times. Choose a basis for choosing a logarithmic scale of 10, but you can also choose any other number in the range from 2 to 1,000.
It is important to note that logarithmic scales can only be used with data that is greater than zero. If your data contains values less than or equal to zero, you will need to adjust your data before creating the chart.
Leave a Reply