How to Create and Customise Box and Whisker Chart in Excel
Box and whisker charts, also known as box plots, are valuable statistical tools for summarizing and visualizing data distributions. We demonstrate how to create and customize box and whisker charts in Excel. We also explore the advantages of using these charts and provide insights into interpreting them.
What is a Box and Whisker chart?
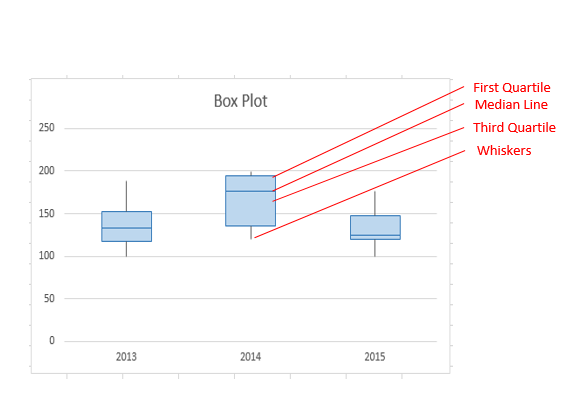
A box and whisker chart is a graphical representation that summarizes essential statistics within a dataset. It highlights the five-number summary: minimum, first quartile (Q1), median, third quartile (Q3), and maximum values.
The chart’s structure consists of a box representing the middle 50% of the data, with the median (Q2) positioned in the middle. Whiskers extend to the minimum and maximum values, excluding outliers, which are depicted as individual points beyond the whiskers.
How to Create a Box and Whisker
The first thing you need to prepare is the data set, which you will want to present in a box and whisker chart. The data you want to create a Box and Whisker plot for should be organized in a single column or row.
You will need to select the entire data set that you want to present and go to the “Insert” tab that is located on the ribbon. Then choose “Insert Statistic Chart” and select “Box and Whisker”.
Excel will generate a box and whisker chart based on your selected data.
How do I customize Box and Whisker?
You can customize the chart exactly how you want. If you want to do it, select the chart, and on the ribbon, two tabs will appear, “Design” and “Format”.
There are some designs that you may like, but there are other options that will certainly help you edit your chart.
If you head right to the “Design” tab, you will find on the left side of the screen a section that is called “Add Chart Element”.
If you click on it, you will have three options where you can choose to add:
- Chart Title – Here you can obviously set how the chart is going to be named.
- Legend – And the legend, which just adds a legend to one side of the chart.
- Horizontal and Vertical axis – Here you can change the size and format of both axis.
To change the options for the box and whisker chart, you will have to right click one of the chart’s boxes. When you select it on the shortcut menu, click “Format Data Series”. Then you will have everything you need to customize it.
Gap width – This determines the gap width between the categories.
Show inner points – This shows the data points that are located between the lower whisker and the upper whisker line.
Show outlier points – This shows the outlier points that are located below the lower whisker line or above the upper whisker line.
Show mean markers – It shows the mean marker.
Show mean line – It shows the line that connects the meanings of boxes in the selected series.
Quartile Calculation – Here you can choose between two methods for median calculation:
- Inclusive median – The median will be included in the calculation if the number of values in the data is odd.
- Exclusive median – The median will be excluded from the calculation if the number of values in the data is odd.
The box and whisker chart is useful for visually summarizing variations in large datasets. It shows outliers and compares multiple distributions. One of the problems is that it doesn’t show the multimodality of distributions. Some people may find the chart complicated, but it’s actually pretty simple, which is also a big plus.


Leave a Reply