How to Create and Customise Box and Whisker Chart in Excel
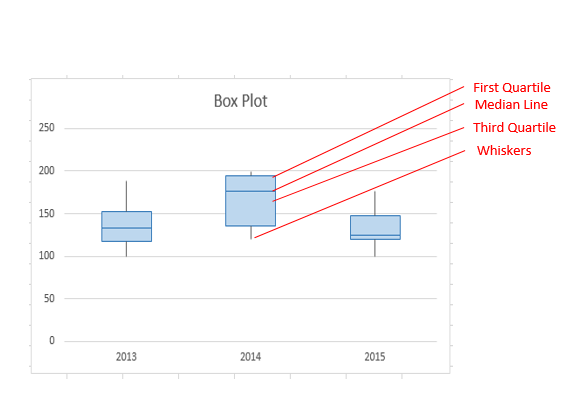
Box and whisker charts, also known as box plots, are valuable statistical tools for summarizing and visualizing data distributions. We demonstrate how to create and customize box and whisker charts in Excel. We also explore the advantages of using these charts and provide insights into interpreting them.