How to Calculate Percentile?
If you have written any competitive exams, you might be familiar with the term percentile. Most of today’s competitive entrance exams publish the results of the applicants based on percentiles. You might be familiar with the term percent. But, it is not the same as percentile.
Do not confuse these terms. As we all know, percentage is a number defined as a fraction of 100. So, if a person says that he scored 60% marks in his GMAT exam, then it means that if total score is 100, he scored 60 marks.
Obviously, if the total score is 50, the person has got 30 marks in the exam.
What is Percentile?
Percentage gives us correct information about how an individual performed on a test, whereas with percentile, you cannot understand the actual score a person achieved. Percentile gives us information about how that score compares to the scores of other test takers.
Excel offers mainly four functions named PERCENTILE.INC, PERCENTILE.EXC, PERCENTRANK.INC and PERCENTRANK.EXC. Let’s calculate the relative percentile scores of 10 students. In that case, we can use either PERCENTRANK.INC or PERCENTRANK.EXC.
The PERCENTRANK.INC function will return the result as a number between 0 and 1 (both inclusive) and PERCENTRANK.EXC function will return the result as a number between 0 and 1 (both exclusive).
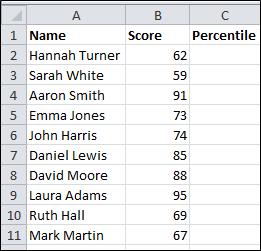
Open Excel and save the file as percentile.xlsx. Type “Name”, “Score” and “Percentile” in the cells A1, A2 and A3. You can format these cells to make them bold. Type any ten names in cells from A2 to A11 and enter any ten marks in cells from B2 to B11.

Syntax
Let’s start from checking the syntax of PERCENTRANK.INC function which will let us to calculate a percentile.
=PERCENTRANK.INC (data range, kth percentile)
- data range: An array or cell range of numeric values
- kth percentile: A percentile value between 0 and 1.
Calculate Percentile
Click cell C2 and go to Formulas (main menu) –> More Functions (in the Function Library group) –> Statistical and select PERCENTRANK.INC function.

You will get a window like this:

In the textbox next to Array, enter B$2:B$11. Enter B2 in the textbox next to X and enter 1 in the textbox next to Significance.

In the formula bar, enter *100 next to the formula.

Copy the formula in cell C1 and paste the same in cells C2 to C11.

If you analyze the data, you could find that the percentile of Sarah White is 0 and the percentile of Laura Adams is 100. If you analyze the scores of all the ten students, you will see that Sarah White has the lowest score and Laura Adams has the highest score.
The percentile of John Harris is 50, which means that 50% of the students (5 out of 10 students) have scored less than John Harris. The students who scored less than John Harris are Hannah Turner, Sarah White, Emma Jones, Ruth Hall, and Mark Martin (a total of 5 students).
If you sort the data by scores, you will get a clearer picture. Copy the whole dataset (cells A1 through C11) and paste it in cells from F1 through H11 in the same worksheet.

Select the newly copied data and go to Data (main menu) > Sort (in the Sort & Filter) section and click Sort.

You will get a window like this:

From the Sort by list, select Score and from the Order list, select Largest to Smallest.

Click OK and now your data will be like this:

Now, you can analyze the data easily.
You can download free a Percentile Calculator template here.


How to calculate percentile in Numpy? : Pythoneo
[…] Check also how to calculate percentile in Excel. […]