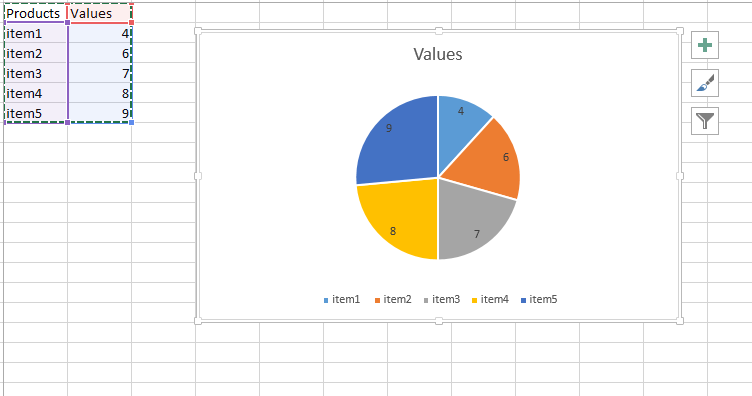
How to create a chart from equation in Excel
In this Excel tutorial, I show you how to create a chart from equation.
The largest Excel knowledge base ✅ The best place to learn Excel online ❤️
In this Excel tutorial, I show you how to create a chart from equation.
Drawing a line between two points in Excel helps illustrate relationships. It’s useful for presentations and data analysis. Follow these easy steps to create a line.
This article will guide you through the step-by-step process of adding a benchmark line to an Excel graph.
A log-log graph is a type of chart that displays data on a logarithmic scale for both the x-axis and the y-axis. This means that the distance between each tick mark on the axis is proportional to the logarithm of the value, rather than the value itself. Log-log graphs are useful for showing data that covers a wide range of values and can reveal patterns or trends that are not obvious on a linear scale graph.
To create a log-log chart follow these steps:
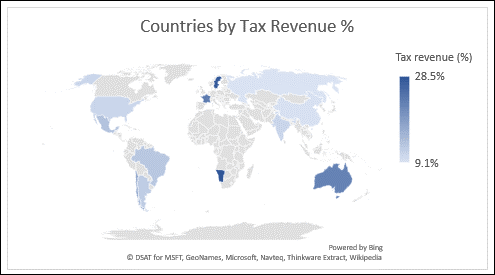
Excel 2016 came with a lot of new features, one of those was a large number of charts that were implemented after several years of no new ones.
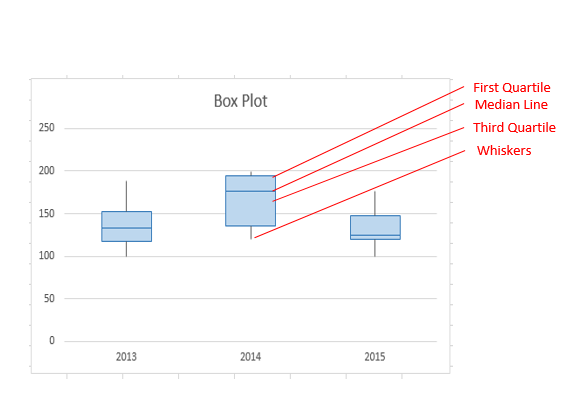
Box and whisker charts, also known as box plots, are valuable statistical tools for summarizing and visualizing data distributions. In this article, we will demonstrate how to create and customize box and whisker charts in Excel. We will also explore the advantages of using these charts and provide insights into interpreting them.
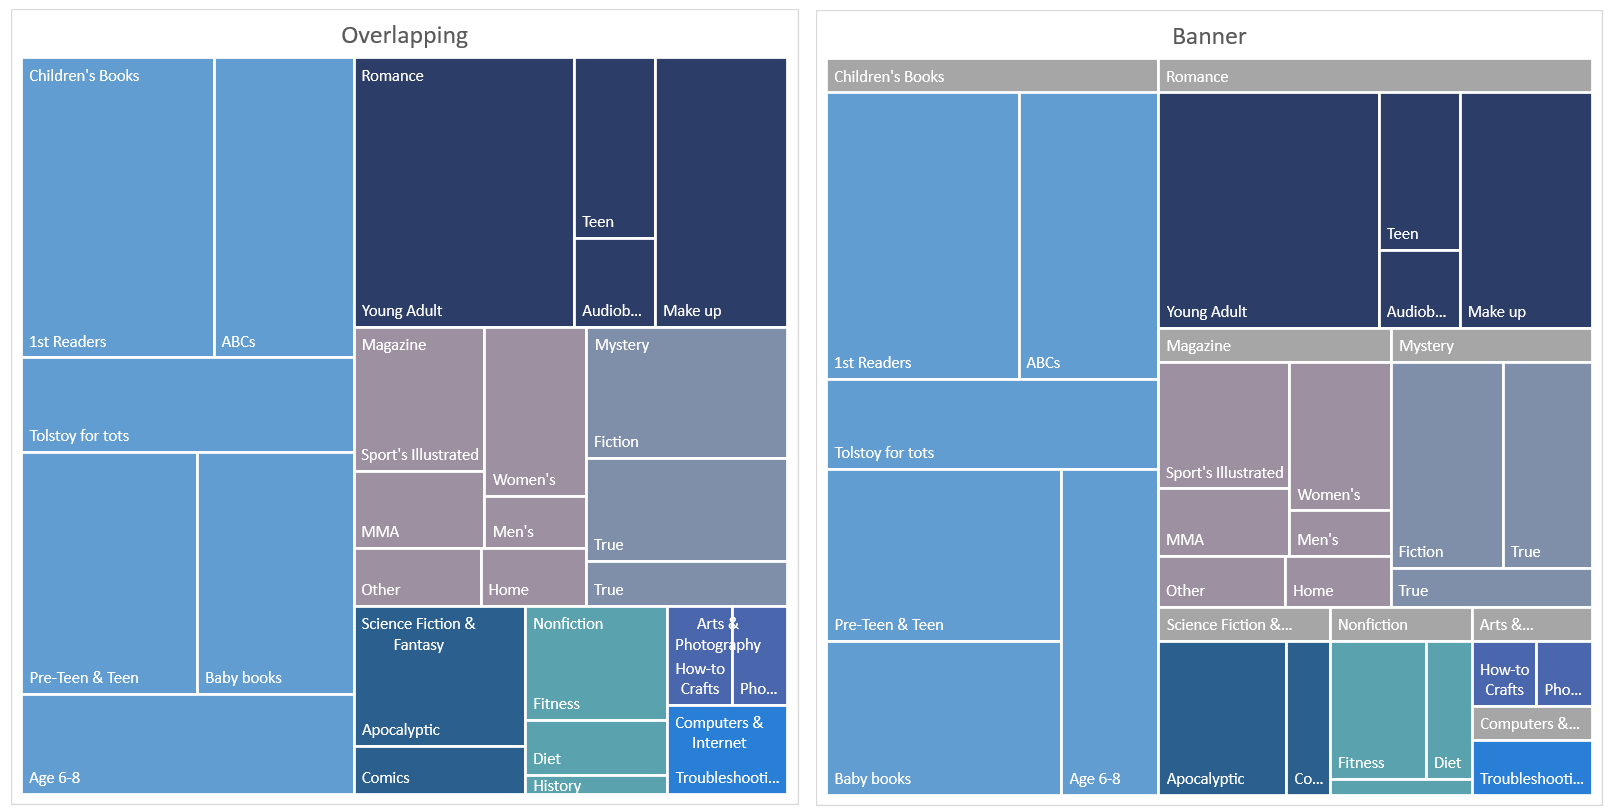
A treemap chart is a chart that displays hierarchical, tree-structured, data using nested rectangles.
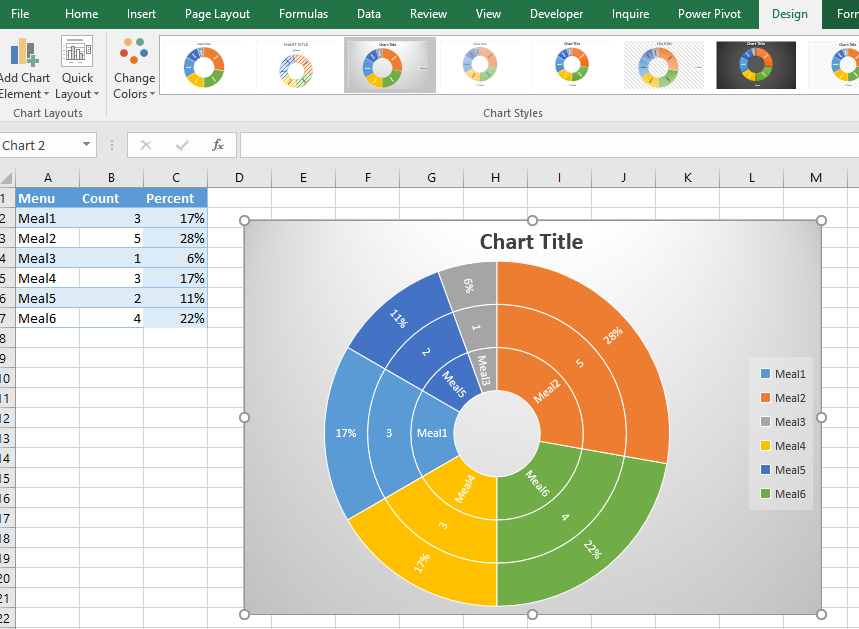
A sunburst chart is a hierarchical chart that uses concentric circles to represent data. It is a great way to visualize large amounts of data and show relationships within a hierarchy.
In this article, we will show you how to create a sunburst chart in Excel. We will also discuss the benefits of using a sunburst chart and how to customize it.
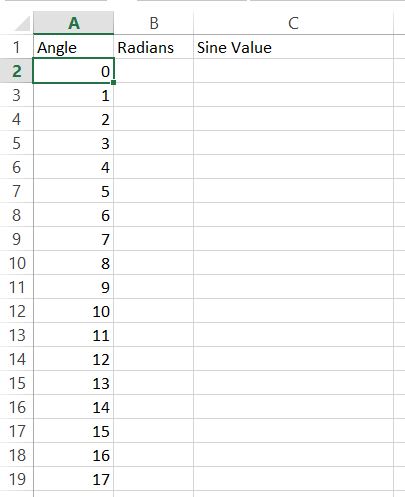
In this Excel charting tutorial, you can learn how to graph a sine wave.