How to Use What If Analysis in Excel
What-If Analysis in Excel allows you to explore how changing input values affect calculated outcomes, essentially working in reverse of standard formulas. Instead of using known inputs to determine an output, What-If Analysis helps you find the input required to achieve a desired output.
This technique is applicable to various scenarios, such as budget planning, investment analysis, and retirement savings projections, with Goal Seek being a prominent tool within this suite.
Monthly EMI calculation
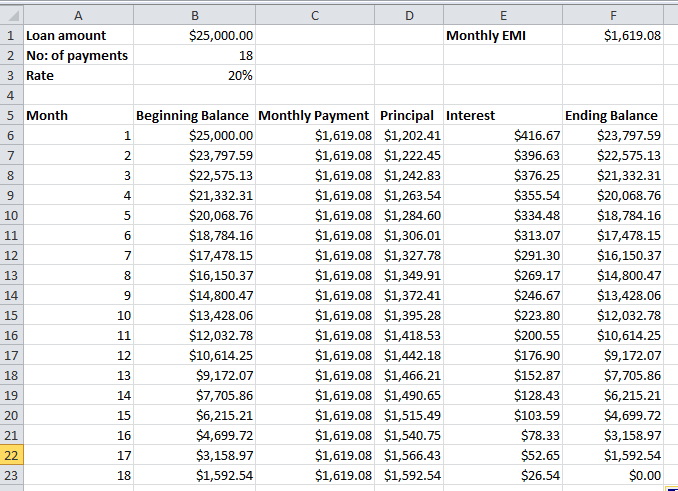
Suppose a person takes a loan for $25,000 from a bank at the interest rate of 20% per annum and he agrees to pay off the loan in one and a half years (18 months).
All remaining data including monthly loan payment, monthly payment towards principal, monthly interest payment and remaining balance to be paid each month are calculated using financial formulas.

In this case, the person has to pay an amount of $1619.08 every month for 18 months to complete the loan. Assume that the person is capable of paying $2500 every month so that he can pay off the loan faster. So, how can we find out in how many months the person will be able to complete the loan if he pays $2500 monthly. Here comes the Goal Seek function into play.
Perform What-if analysis
Open Excel, copy the data shown above and save your file as What-if analysis.xlsx. Go to Data (main menu) > What-if analysis (in the Data Tools group) and select Goal Seek.

You will see a window like this:

Click in the textbox next to Set cell and click the cell E1 as we need to analyze the result by changing the monthly payment. In the To value: textbox, enter 2500 as this is our new value. After clicking in the By changing cell: textbox, click the cell B2 as we want to find out the change in number of payments (number of months).

Excel will recalculate and tell you how many months it will take to pay off the loan at $2,500 per month.

If you analyze the value in cell B2, you could find that it is 11.03. It means that you can complete the loan in less than a year (in 11.03 months) if you make a payment of $2,500 per month.
Notes average calculations
Suppose you are a student who plans to score an average of 80 in your semester exam. You scored 82, 70, 83 and 76 in the subjects English, Mathematics, Computer Science and Mechanics respectively. You have Statistics exam remaining and you want to calculate the marks you need to score in Statistics to achieve an average of 80.

Select the Goal Seek function to open the window. Click in the textbox next to Set cell: and click the cell that contains the average score (here the cell containing the value 77.5). In the To value: textbox, enter 80 as this is your target average.
After clicking in the By changing cell textbox, click the cell that will contain the score of Statistics (here the cell just above the cell with 77.5).

From this data, it is clear that you have to score 89 in Statistics to achieve an overall average of 80. Similarly, you can use Goal Seek function in many different scenarios to analyze what input should be given in order to get a specific output.


Gentner
This website is a great source for details on these subjects.