How to Open a DIF File in Excel
A DIF file is a data interchange file that can be used to exchange data between different applications. Excel can open DIF files, but there are a few things to keep in mind.
Excel Skills Simplified: Tutorials That Actually Work
A DIF file is a data interchange file that can be used to exchange data between different applications. Excel can open DIF files, but there are a few things to keep in mind.
Cohort analysis is a valuable technique that helps track and analyze the behavior of specific groups of users over time. By using cohort analysis, businesses can gain insights into user retention, engagement, and behavioral patterns.
While there are specialized tools for this analysis, Excel provides a versatile platform to perform cohort analysis effectively. Here’s how you can conduct cohort analysis in Excel.
When dealing with fluid dynamics and the analysis of fluid behavior in various systems, understanding the Reynolds number is crucial. The Reynolds number, named after Osborne Reynolds, is a dimensionless value that characterizes the flow regime of a fluid, providing insights into whether the flow is laminar, transitional, or turbulent.
Utilizing Excel to calculate the Reynolds number simplifies this vital analysis, assisting engineers, researchers, and analysts in making well-informed decisions.
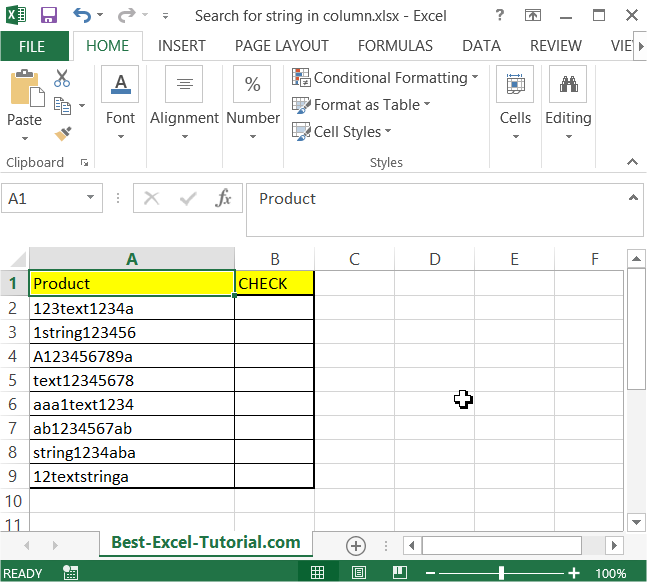
In this article, you will teach yourself how to search for string in column. You may need this trick when you want to check if the cell contains string you need.
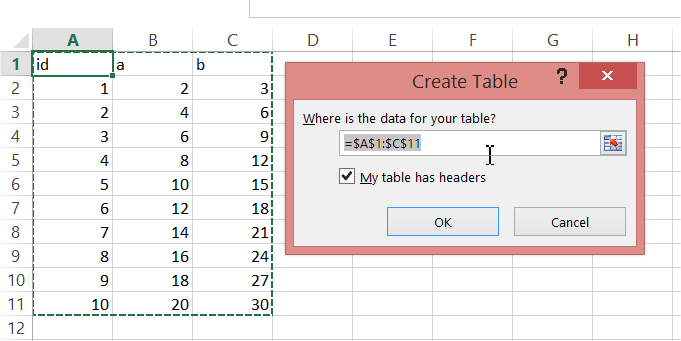
Creating a Pivot Table from multiple sheets in Excel can be a powerful way to analyze data spread across different sources. You will learn how to make a Pivot Table from many sheets from this step-by-step guideline.
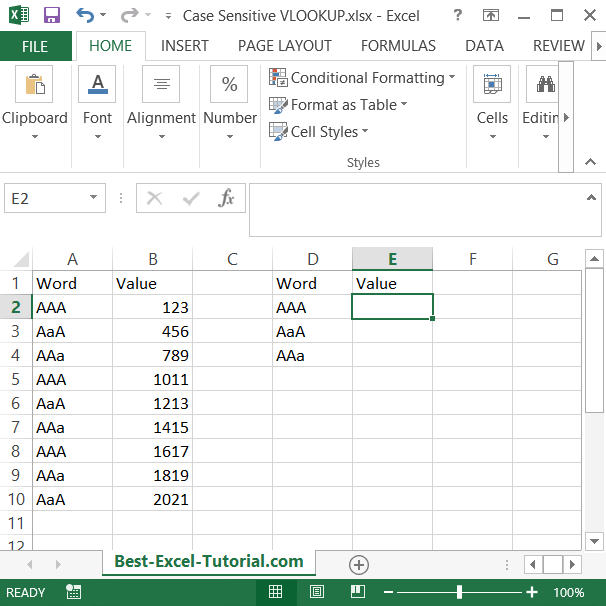
In this Excel lesson, you will teach yourself how to create a case-sensitive vlookup. This is a clever way to solve many problems caused by caps lock keyboard button.
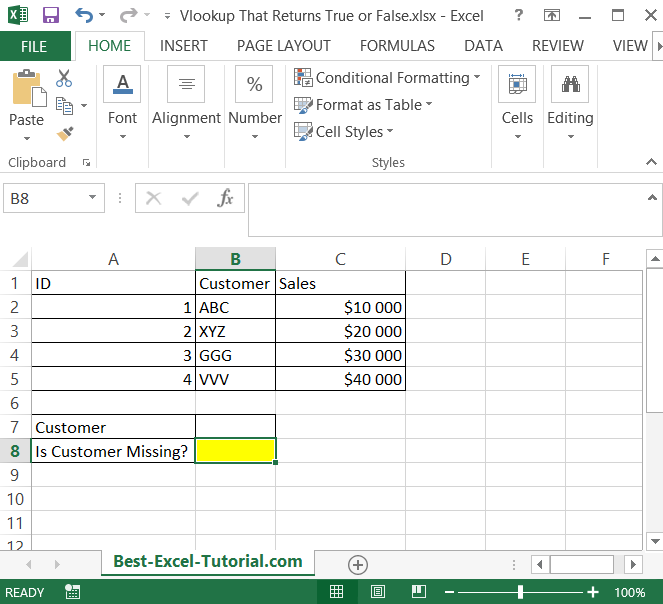
The VLOOKUP function in Excel can be used to return a value from a table based on a lookup value. However, sometimes you might want to return a simple True or False result based on whether or not a value exists in a table.
In this article, you learn how to create a vlookup formula which returns just true of false. You may need it to check if you have some data missing.
Converting image data into an Excel spreadsheet enables you to work with extracted information efficiently. Whether you’re dealing with scanned invoices, tables from photos, or data-rich documents, Excel provides the perfect environment to organize, validate, and analyze your converted data. Here’s how to handle JPG to Excel conversion with a strong focus on Excel’s tools and features.
Mastering the RANK function in Excel is crucial if you want to organise and analyse data by position. It shows how high or low each value stands compared to the rest of the list. This guide explains how RANK works and how to use it effectively in your spreadsheets.