Best Excel Tutorial
Excel Skills Simplified: Tutorials That Actually Work
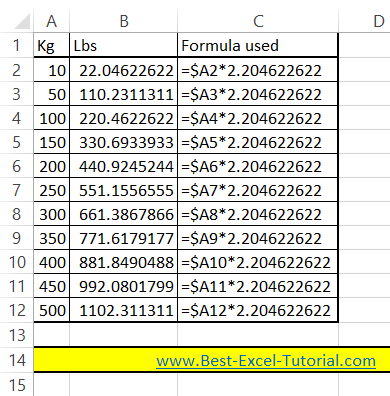
Kg to lbs and lbs to kg converter
In this Excel tutorial lesson, you learn how to convert kg to lbs (pounds) and lbs to kg using the Microsoft Excel application.
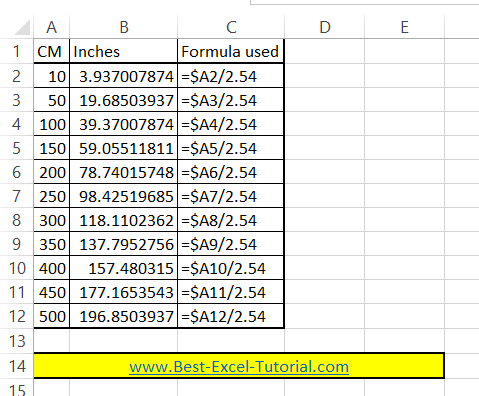
Cm to inches and inches to cm converter
In this Excel tutorial lesson, you will learn how to convert cm to inches, cm to feet and inches and inches to cm using the Microsoft Excel application.
How to Shuffle Data in Excel
Shuffling data in Excel is a critical task for randomizing lists for sampling, scheduling, or bias prevention. This guide shows you how to shuffle and randomize data effectively using various Excel methods and functions.
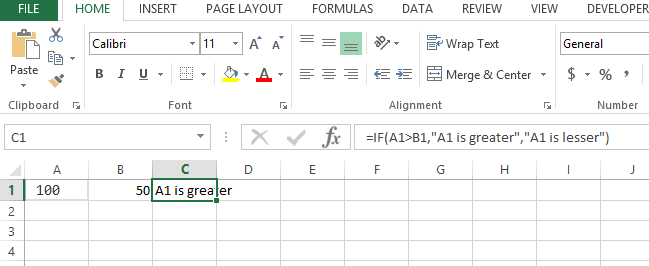
If Function with multiple conditions
In this article, I will guide you to write simple if functions as well as the complex if functions with multiple conditions or we also call it nested if functions.
Lets start with simple if function in Excel formulas:
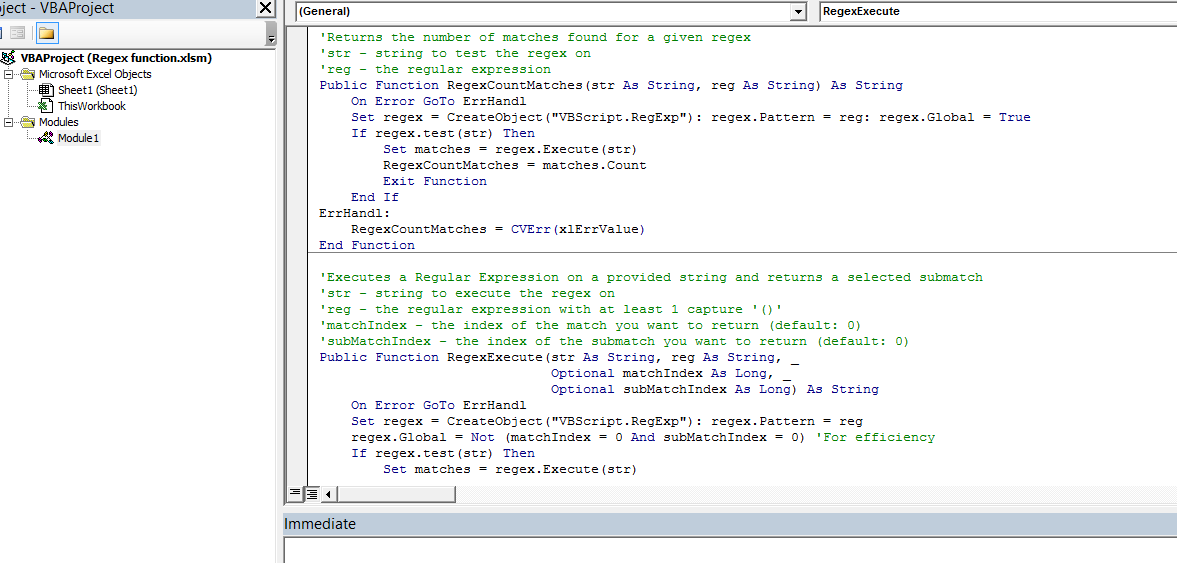
Regular Expression in Excel Vba
In this article we will learn to use Regex in Excel.
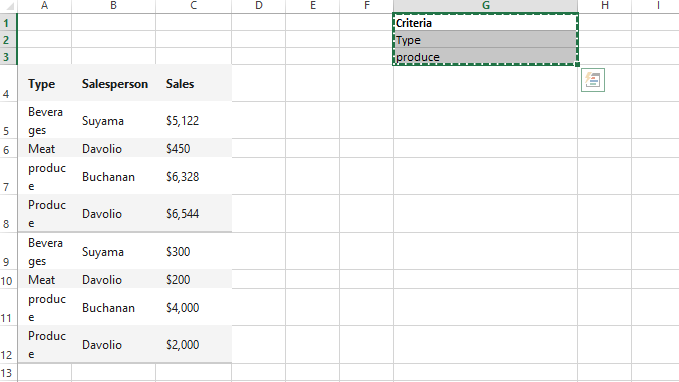
How to Use the Double Filter in Excel to Filter Data by Multiple Criteria
The double filter is a powerful tool in Excel that allows you to filter data by multiple criteria. This can be useful for finding specific data points or for comparing different data sets.
In this article, we will show you how to use the double filter in Excel. We will start by explaining the basics of the double filter, and then we will show you how to use it to filter data by multiple criteria.
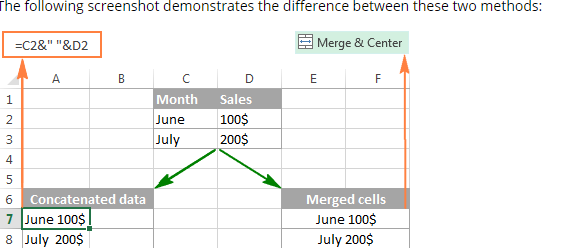
How to Concatenate Cells in Excel
In this article, I will guide you on how to concatenate multiple cells quickly using different methods with examples. You’ll also learn why concatenation is often preferred over merging cells.
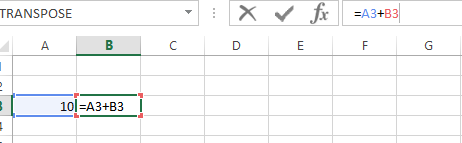
How to get rid of circular references?
In this Excel tutorial, you will learn how to remove the circular references in an Excel file.