How to Create Interactive Charts in Excel
Follow these steps to create Interactive Charts in Excel using dummy data. This comprehensive guide will walk you through setting up the data, defining named ranges, creating a Combo Box, and linking it all together to create an interactive experience.
Table of Contents
Create data set
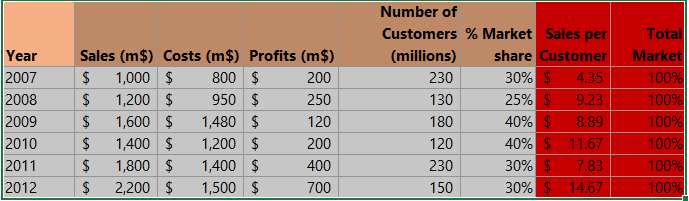
On a new sheet (give this sheet the name “Data and Chart interactive sheet”), first create a table and add data to it. Create all the charts you want.

Select all the cells, corresponding to the first chart. Click on the FORMULAS tab and select Define Name. Give any name (in our case it’s chart 1).


Note: In this case the first chart is Sales and Costs chart so select all the cells of Sales (m$) and Costs (m$).
Repeat the process for all the charts.
Note: We are making 4 charts in this example so we will name them in this order: chart1, chart2, chart3 and chart4.
In a separate range of cells, list down all the chart names. Give this range a name like 1stChartTypes.

Add a new sheet to your workbook. Give it a name. We will call our interactive output sheet.
Combo Box
In the new sheet create a Combo Box by clicking on the DEVELOPER tab and then clicking INSERT and clicking on the Combo Box icon.

Right-click on Combo Box and press CTRL+1 keyboard shortcut. Specify Input range 1stChartTypes and Cell link as a blank cell in your output sheet (in our case interactive sheet output).

Now we are going to pull corresponding chart based on user selection. Enter a named range called selChart.
Click on FORMULAS tab and then click on Define Name. Give the name as selChart and define it as
=CHOOSE (Linked_cell, Chart1, Chart2, Chart3, Chart4)
Now, go back to Data and Chart sheet. Select Chart1 range.Press CTRL+C to copy it. Go to Output sheet and past it as linked picture.

Click on the picture, go to the formula bar and type =selChart and press enter. That’s it, you have now created an interactive sheet.
A chart
This is what your final chart will look like:


Free Interactive Charts template to download here
By following this comprehensive approach, you have successfully created Interactive Charts in Excel. This powerful setup allows you to dynamically switch between different charts by selecting options from a Combo Box, thereby enhancing data interaction and visualization in your Excel workbook.


Leave a Reply