How to Highlight Duplicates in Excel: Complete Step-by-Step Guide
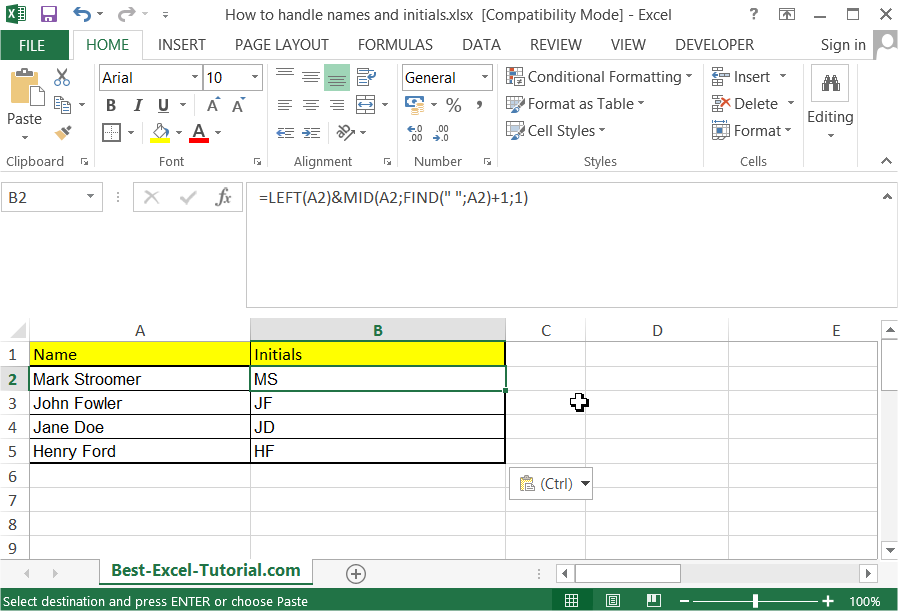
Highlighting duplicates in Excel is a common task that allows you to quickly identify and manage repeated values in your data. Excel provides an easy way to do this using Conditional Formatting. To highlight duplicates, first select the cells you want to check. This can be a single column, multiple columns, or a specific data range.