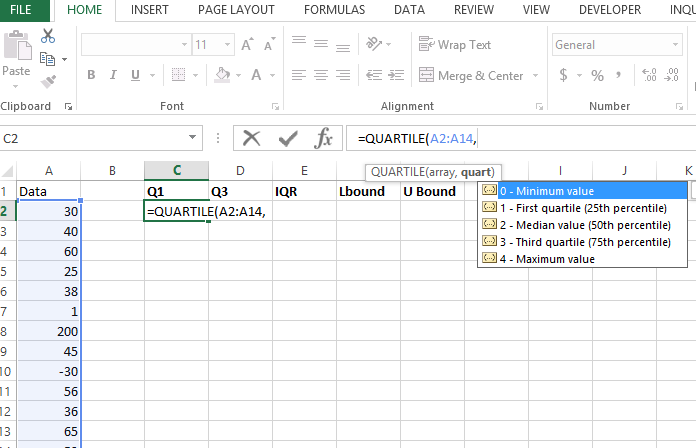
How to Find Outliers in Excel
In this article, we will learn how to find outliers in Excel.
Excel Skills Simplified: Tutorials That Actually Work
In this article, we will learn how to find outliers in Excel.
In this article, we will learn how to activate and use the Inquire Add-in which is an inbuilt add in for Excel use.
When it comes to analyzing non-parametric data and comparing two independent samples, the Mann-Whitney U test is a valuable tool. This statistical test allows you to determine if there are significant differences between the distributions of two groups. While performing the test manually might be intricate, using Excel simplifies the process, enabling you to make data-driven decisions with ease.
Cohort analysis is a valuable technique that helps track and analyze the behavior of specific groups of users over time. By using cohort analysis, businesses can gain insights into user retention, engagement, and behavioral patterns.
While there are specialized tools for this analysis, Excel provides a versatile platform to perform cohort analysis effectively. Here’s how you can conduct cohort analysis in Excel.
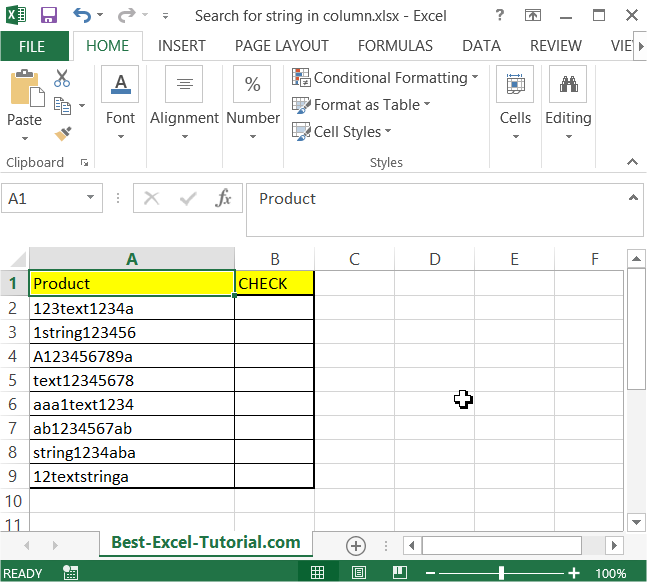
In this article, you will teach yourself how to search for string in column. You may need this trick when you want to check if the cell contains string you need.
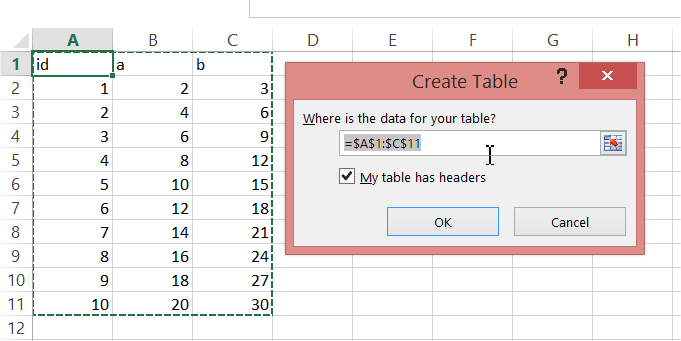
Creating a Pivot Table from multiple sheets in Excel can be a powerful way to analyze data spread across different sources. You will learn how to make a Pivot Table from many sheets from this step-by-step guideline.
Mastering the RANK function in Excel is crucial if you want to organise and analyse data by position. It shows how high or low each value stands compared to the rest of the list. This guide explains how RANK works and how to use it effectively in your spreadsheets.
The Vector Error Correction Model (VECM) is an econometric model used to analyze cointegrated time series data. It extends the Error Correction Model (ECM) to multiple variables, enabling you to capture both short-term dynamics and long-term relationships among several non-stationary time series. VECM is widely utilized in econometrics, especially when dealing with non-stationary data that share a long-term equilibrium relationship.
Implementing a VECM in Excel is challenging due to the advanced statistical computations required, such as conducting Johansen’s cointegration test, estimating cointegration vectors, and constructing error correction terms. Specialized statistical software like R, EViews, or Stata is typically preferred for these tasks because they offer built-in functions that handle complex calculations efficiently.
Excel is the industry standard for financial modeling, offering powerful tools to build comprehensive models that simulate business scenarios and forecast financial performance. By leveraging Excel’s formulas, functions, and structural capabilities, you can create dynamic models that enable informed decision-making based on scenario analysis and sensitivity testing.
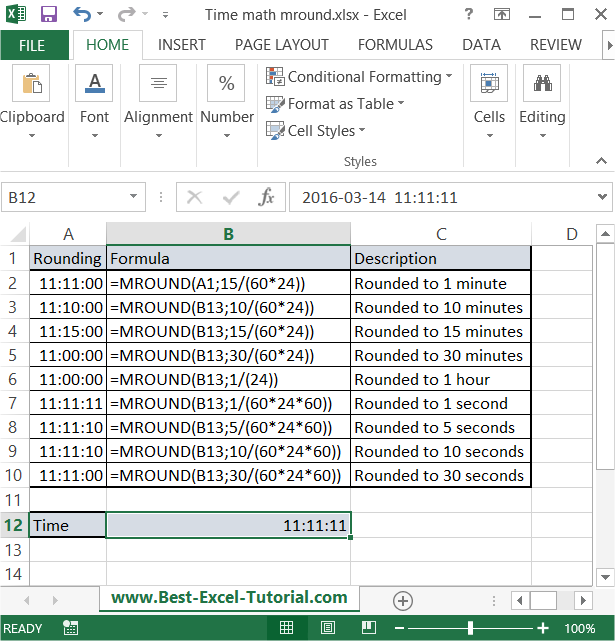
In this Excel tutorial, you will learn yourself how to round to nearest time. This kind of time math is particularly useful in spreadsheets where you deal with tracking time, such as for scheduling or payroll.