How to calculate Kurtosis in Excel
In this Excel tutorial, you will learn how to calculate a Kurtosis in Excel.
What is the Kurtosis?
Kurtosis is a measure of the concentration of results. Kurtosis informs us about how our observations and the results are concentrated around the mean. This measure tells us how much of your results or observations are close to the average, or how many of the observed results have a value similar to the average.
Kurtosis determines the strength of the extreme value instrument, so it measures what happens in the “tails” of the classification. Contrary to what is stated, alien to some textbooks, kurtosis does not measure the “flattening”, “slenderness” and “pointedness” of the distribution.
Probability distributions can be divided according to the value of kurtosis into the following distributions:
- mesokurtic – the kurtosis value is 0, the flattening of the distribution is similar to the flattening of a normal distribution (for which the kurtosis is exactly 0)
- leptokurtic – kurtosis is positive, trait values are more concentrated than with normal distribution
- platykurtic – kurtosis is negative, trait values are less concentrated than with normal distribution
Syntax
KURT (number1, number2, …)
Number 1, number2, … are the arguments 1 through 255 for which the kurtosis is calculated. A single array or an array reference can be used in place of arguments separated by commas. If there are fewer than four data points, or if the sample standard deviation is zero, KURT returns #DIV / 0! Error value.
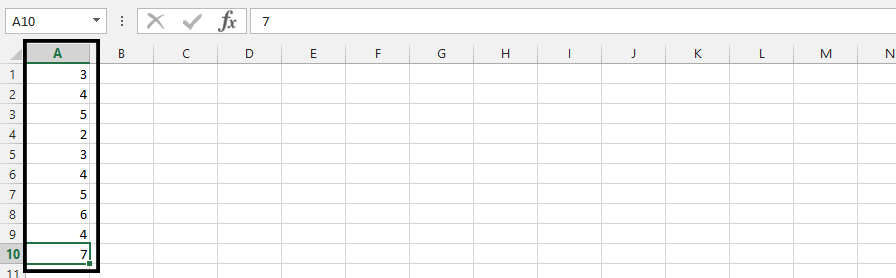
The calculation of kurtosis is possible, but you initially need data such as this:

How to calculate?
You should click on an empty cell (1), and type =KURT(all the cells, ex. A1:A10) (2), then press enter.
Kurt Excel function has been used here.

Investors often use kurtosis as it provides information about the risk and rate of return on their investment. High rate of return kurtosis increases the likelihood of achieving a higher rate of return on investment. Thus, investors are willing to pay more for investments with a leptokurtic schedule than for investments with a platykurtic schedule. Knowing the actual distribution of the rate of return on a given investment allows you to better manage the investor’s risk and portfolio, and also allows you to construct a range in which the investor can expect a rate of return.
The KURT function will return the kurtosis of your data set. Note that the KURT function calculates the excess kurtosis, which is the kurtosis of a set of values minus 3.
A kurtosis value of 3 represents a normal distribution, and values greater than 3 indicate a distribution with a heavier tail than a normal distribution.
In addition to the KURT function, you can also calculate the kurtosis of your data set using the following formula:
=SUM((A2:A11-AVERAGE(A2:A11))^4)/COUNT(A2:A11)/(STDEV(A2:A11)^4) – 3
Replace the range A2:A11 with the range of cells that contains your data. The formula will return the excess kurtosis of your data set.


Leave a Reply