How to Use an Option Button in Excel: Complete Guide with 6 Practical Applications
In this lesson, you’ll learn how to insert Option Buttons (also known as Radio Buttons) in Excel. Option Buttons allow you to choose one option from a group. Here’s how to use them:
Table of Contents
Insert Option Button
To insert Option Button to your worksheet you should go to the Ribbon. Click Developer > Insert > Form Controls > Option Button.
Next draw your Radio Button with your mouse. Click and drag on the worksheet to draw the option buttons. You can create as many option buttons as you need.
Edit name
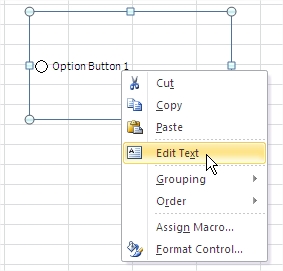
To change the text on an Option Button, right-click, choose Edit Text, and make your changes.

Link with cell
To link Radio Button with cell right-click and go to Format Control. Go to Control and write the address of the cell.


To link an option button to a cell in Excel, you can use the “CELL” function. The value in the cell will change when you select a different option button, allowing you to use the value in other parts of your worksheet.
Create a Survey
Using Option Buttons in Excel you can easily create your own survey in Excel. Here you have screenshot with example on survey in Excel.

These survey automation features using grouped radio button controls provide an intuitive approach for collecting Excel survey responses efficiently.
To implement interactive form controls in your workbook, simply insert radio button components within a grouped box framework, enabling seamless portability across Microsoft Office applications.
Assign macros
To perform an action when an option button is selected, you can assign a macro to the option button. Right-click on the option button and select “Assign Macro”.
Create a chart
You can use Option Buttons to create dynamic charts. Modify your data based on Option Button selections to update the chart accordingly.
Now we can clearly see that there are 2 categories of products. A simple graph will look like this:

Now we will start creating the options for the same. We created new columns which have the following formulas:
=IF(J1,C1,E1)
So based on value in cell j1 it can be product2 or Products A
For based on value in cell j1 it can be product3 or Products B
So now we have added a checkbox and linked it to the cell j1 and in the graph we have changed the series types including product1 and last 2 column products which can vary.

Unchecking the option:

Advanced Techniques with Option Buttons and VBA
Utilizing VBA (Visual Basic for Applications) alongside Option Buttons can take your Excel projects to an advanced level of functionality and interactivity. Here’s how:
Dynamic Charts and Dashboards
Sub UpdateChart()

Dim SelectedMonth As String

SelectedMonth = ActiveSheet.Shapes("OptionButton1").OLEFormat.Object.Object.Value

' Assuming you have named ranges for your chart data

ActiveSheet.ChartObjects("YourChartName").Chart.SetSourceData Source:=Range(SelectedMonth)

End Sub
Data Filtering and Sorting
You can use Option Buttons to control data filtering or sorting. For instance, if you have a table of products and want to filter by category, create Option Buttons for each category. When a button is selected, a VBA macro can apply the filter accordingly.
Sub ApplyFilter()

Dim SelectedCategory As String

SelectedCategory = ActiveSheet.Shapes("OptionButton1").OLEFormat.Object.Object.Value

ActiveSheet.ListObjects("YourTableName").Range.AutoFilter Field:=2, Criteria1:=SelectedCategory

End Sub
User Forms and Data Entry
Combine Option Buttons with user forms to create data entry interfaces. For example, if you’re building a survey, use Option Buttons in a user form to capture responses, and store the data in your Excel workbook using VBA.
Sub SubmitSurvey()

Dim Response As String

Response = ActiveSheet.Shapes("OptionButton1").OLEFormat.Object.Object.Value

' Write the response to a specific cell

ActiveSheet.Range("A1").Value = Response

End Sub
These advanced techniques showcase how combining Option Buttons with VBA can enhance your Excel workbooks, making them more interactive, error-resistant, and tailored to your specific needs.


Madeline
Superb site you have here