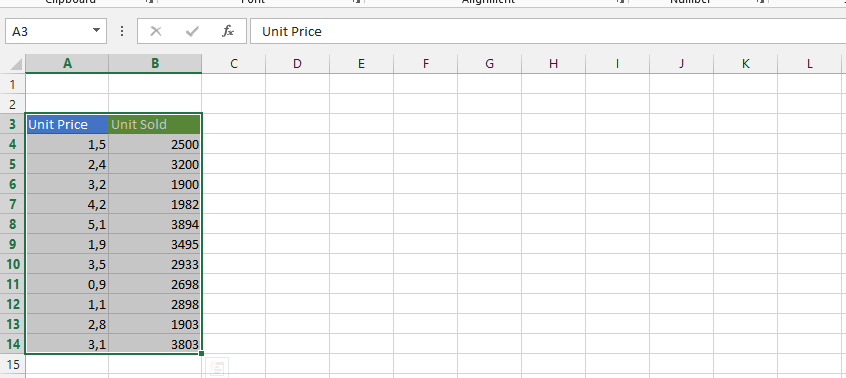
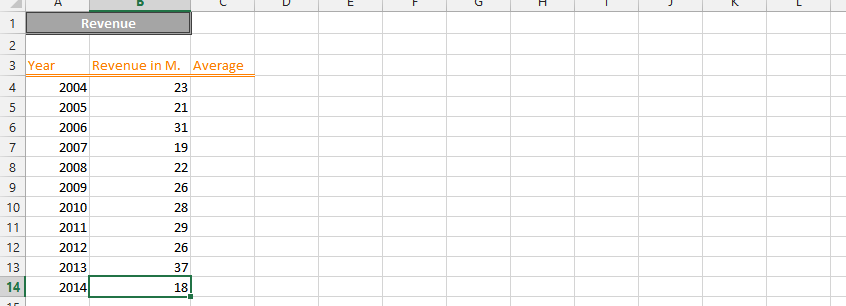
How to Use Excel Templates
Using a template is about choosing the one that perfectly suit the purpose. If you for instance want to do event planning, pick the template that is for event planning. You will learn how to use a template.
Excel Skills Simplified: Tutorials That Actually Work

Using a template is about choosing the one that perfectly suit the purpose. If you for instance want to do event planning, pick the template that is for event planning. You will learn how to use a template.

A butterfly chart, which is also known as a tornado chart, is a type of chart used to visualize the changes in the difference between two variables over time. To create a butterfly chart in Excel, you’ll use a stacked bar chart format. It is called a butterfly chart because it resembles the shape of a butterfly, with two “wings” representing the changes in the two variables. This chart is particularly useful for visualizing and comparing changes in the spread between two data sets.

Standard deviation is a commonly used statistic in finance and economics to measure the volatility or risk of a security or portfolio. By plotting the standard deviation over time, you can create a volatility chart that shows how the volatility of a security or portfolio has changed over time. This type of chart is known as a standard deviation volatility chart.
Creating a standard deviation volatility chart in Excel is about understanding how a security’s volatility or price fluctuations have changed over a specific period of time.

In this Excel tutorial, you will learn how to craft a timeline chart – a powerful tool for representing events or milestones along a timescale. Here’s a step-by-step guide on how to create a timeline chart in Excel:

You are going to learn how to insert a surface chart, and it will be easy to perform.

This Excel tutorial guides you through the process of inserting and formatting a Radar Chart, also known as a Spider Chart or Web Chart.

You will learn how to do mathematical calculations and how to create a Q-Q plot in Excel, also called a probability chart (to be exact, it is a normal distribution probability plot).

The calculation of BMI (Body Mass Index) is purposely meant to know if the person has a normal, overweight, or obese weight. This is possibly done by certain components that make the BMI calculation a possibility. We will now build a comprehensive BMI calculator in Excel and execute the formula calculations to analyze body mass index values.