How to Stop Excel from Changing Numbers to Dates
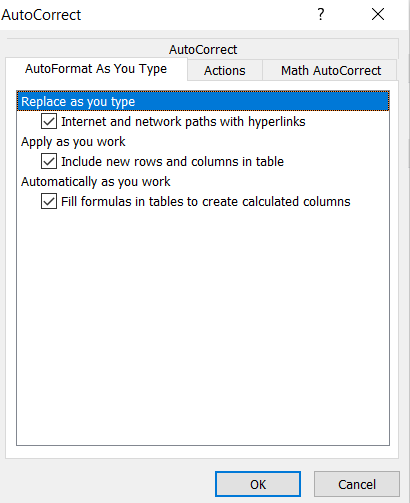
Excel has autocorrect data input turned on by default. After pasting the number into the cell, it is automatically replaced with the date. If the Excel number has a similar length as the date, it will go crazy and change the number to a date.
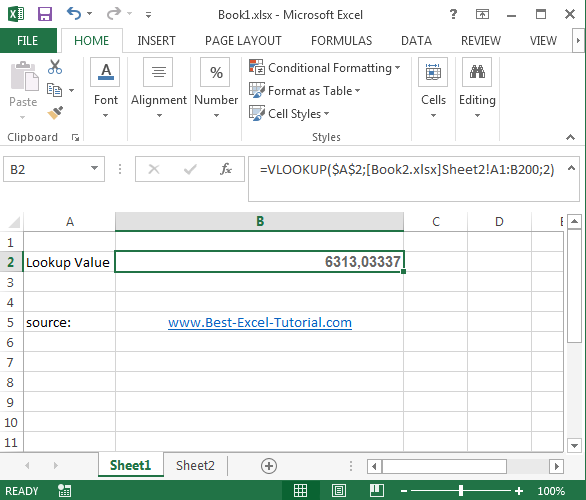
This changes the contents of the cell. A strange date appears instead of a number. These are often dates from hundreds of years ago or from the future.