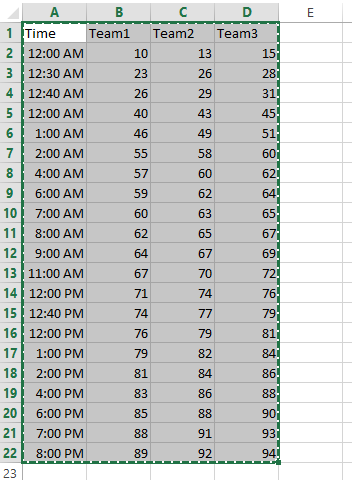
How to Create a Time Series Chart with Hours in Excel
In this Excel charting tutorial lesson, you will learn how to create an Excel chart with hours in the best way possible.
Excel Skills Simplified: Tutorials That Actually Work
In this Excel charting tutorial lesson, you will learn how to create an Excel chart with hours in the best way possible.
We will learn to create graphs which can be handled by data filters to look more easy and customizable.
In this article, we will try to learn the method for creating charts with confidence interval in Excel.
In Microsoft Excel, you can add an average line to a chart to show the average value for the data in your chart. In this Excel tutorial, you will learn how to create a chart with an average line.
In this charting tutorial, we will create the Excel chart with arrows. To create a chart with arrows in Excel, you can use a combination of the built-in chart types and custom shapes.
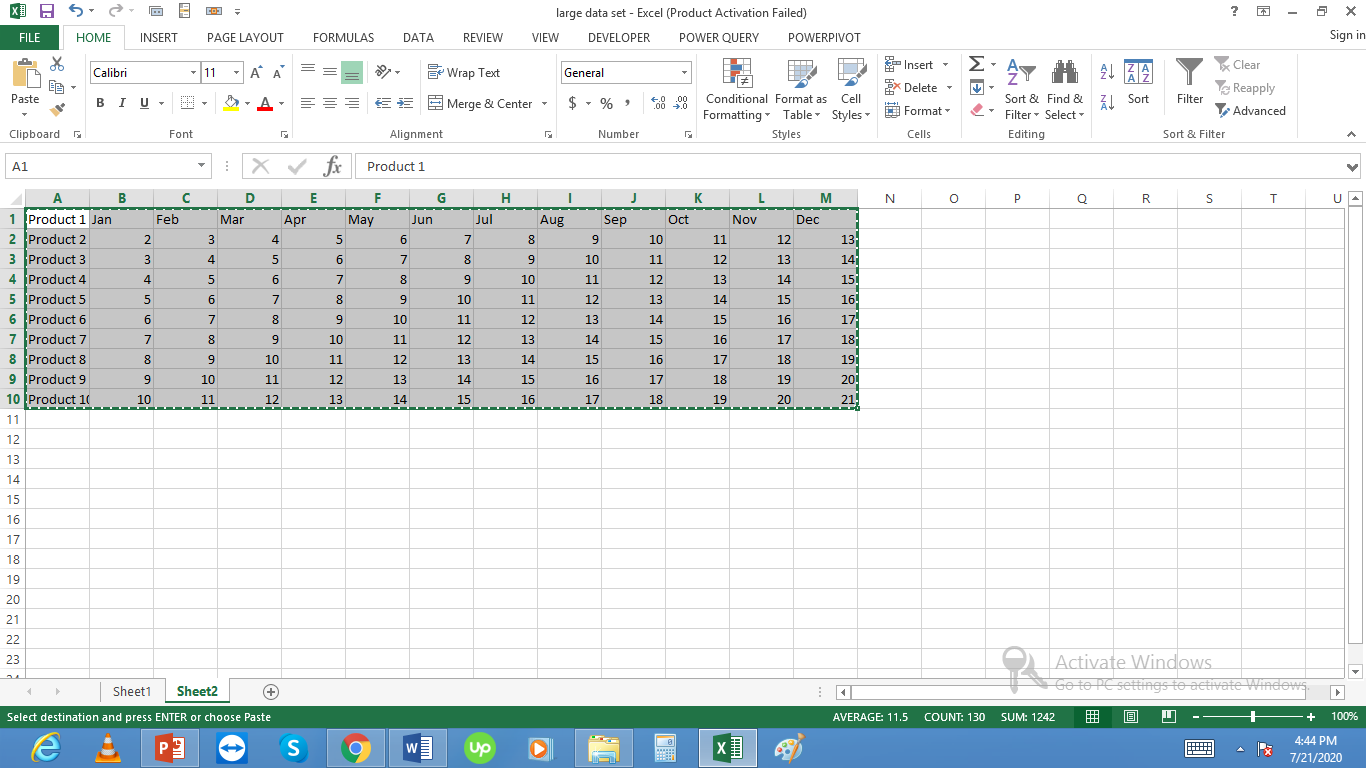
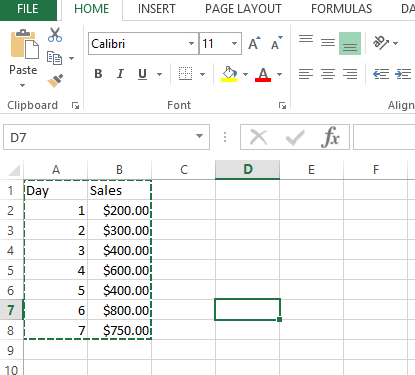
We will create charts with lots of data. We will start with simple chart creation and then move on to more complex charts with large amounts of data in them.
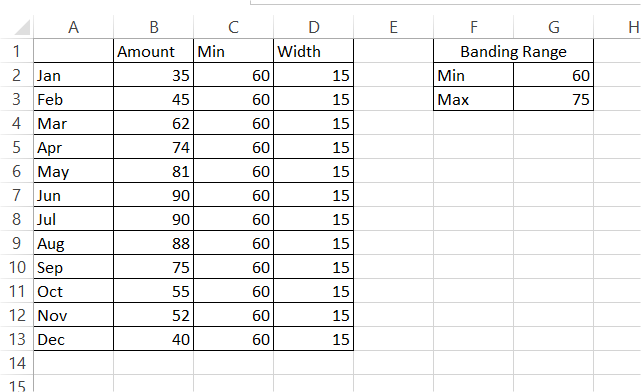
In this Excel tutorial, you will learn how to create a chart with horizontal bands. Adding horizontal bands can be useful for visualizing thresholds, target zones, or performance levels on a chart.
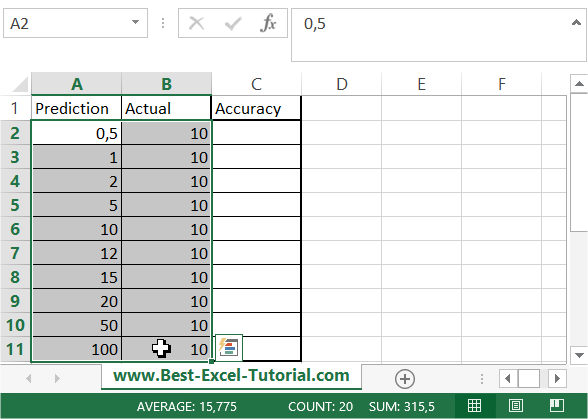
In this Excel tutorial you will teach yourself how to calculate forecast accuracy and precision.
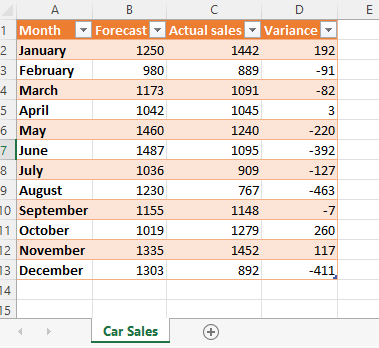
You certainly know how to calculate a variance in Excel. But do you know how to insert variance graphs?
Variance charts in Excel can be used when you wish to compare two sets of data, for example, if you wish to compare the sales forecasts to the actual sales over a period.