How to Calculate CAPM?
The Capital Asset Pricing Model (CAPM) is a financial model that helps to determine the expected return on an investment based on its risk. Here’s how you can calculate CAPM in Microsoft Excel.
Definition of CAPM
CAPM or Capital Asset Pricing Model helps to calculate the cost of equity for an investment. Using the CAPM formula we can find the expected return for an asset. It can further be used for financial ratio like – Sharpe Ratio and others.
The CAPM states that the expected return of an asset is equal to the risk-free rate of return plus a risk premium, which is proportional to the asset’s beta. The beta coefficient measures the volatility of an asset’s returns relative to the overall market. An asset with a beta greater than 1 is considered more risky than the market, while an asset with a beta less than 1 is considered less risky.
The CAPM is widely used by investment professionals and financial analysts as a tool for calculating the required rate of return on an investment, as well as for asset pricing and portfolio optimization. However, it has also been criticized for its oversimplifications and assumptions, and it is important to consider its limitations when using it for investment decision-making.
CAPM Formula with its components
Er = Rf + [Bi x (Rm – Rrf)]
- Er = expected return of investment
- Rf = risk free rate
- Bi – beta of investment
- Rm = Expected return on the market
- Rm – Rrf – market risk premium
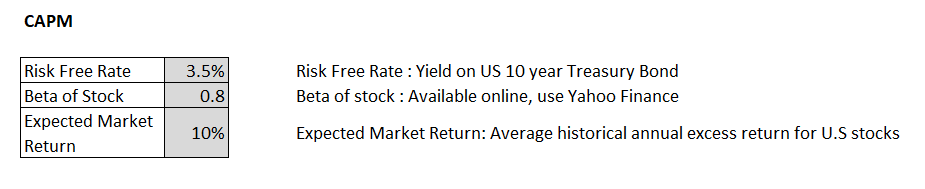
Step 1: Input the values which act as input for the CAPM Model. The details of the input will be available online as mentioned in the sources.
Begin by entering the following data into your worksheet: the risk-free rate (typically the yield on a Treasury bond), the expected market return, and the beta coefficient for the asset being analyzed.
Next, calculate the average market return. You can use data from a market index, such as the S&P 500, to calculate the market return. To do this, you’ll need to gather data on the closing prices of the market index over a period of time, such as the past year. You can then calculate the average return using the following formula in Excel:
=AVERAGE((End of Period Price – Start of Period Price) / Start of Period Price)
For example, if you have data on the closing prices of the S&P 500 for the past year, you would use this formula to calculate the average return:
=AVERAGE((B2:B253 – B1:B252) / B1:B252)

Step 2. Calculate Expected Return using the CAPM Formula.
Expected Return: Risk Free Rate + Beta *(Expected Market Return – Risk Free rate)

Expected return = 8,7%
Plot the results. To visualize the relationship between beta and expected return, you can plot the data in a scatter chart. Select the two columns of data (one for beta, one for expected return), go to the “Insert” tab, select “Scatter” (or “Scatter with only Markers”), and choose the first option.
It’s important to keep in mind that the CAPM is just a model, and it may not always accurately predict the actual return on an investment. There are other factors that can impact investment returns, such as market conditions, company-specific risks, and macroeconomic events.
CAPM with Country Risk premium(CRP) – For Foreign Investments
The Country Risk Premium (CRP) represents the additional return an investor expects when investing in a foreign company.
When to use CRP?
- If the investment is done in foreign land, overseas investment
- If there is higher political and geographical risk associated with this risk
- CRP for developing / turbulent countries is higher than developed countries. The higher the risk of a country the higher the value of CRP.

Formula:
Expected Return: Risk Free Rate + Beta *(Expected Market Return – Risk Free rate) + Country Risk Premium

Expected return = 24,7%
Feel free to use the CAPM calculator for your own needs.
A common mistake when calculating CAPM is to use an inconsistent time period for market returns and risk-free rates. Always ensure these values are aligned to the same timeframe.

Leave a Reply