How to Make a Goal Chart in Excel
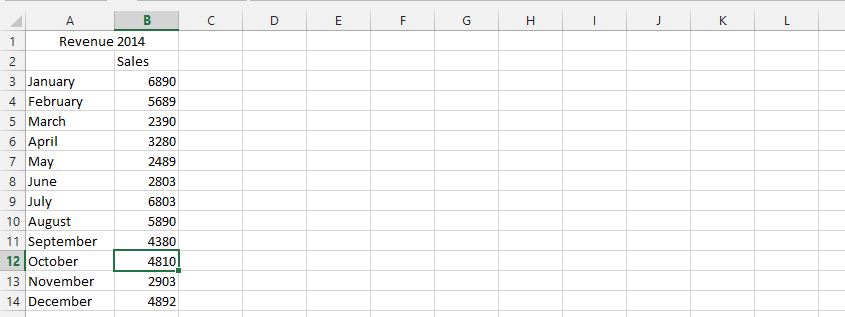
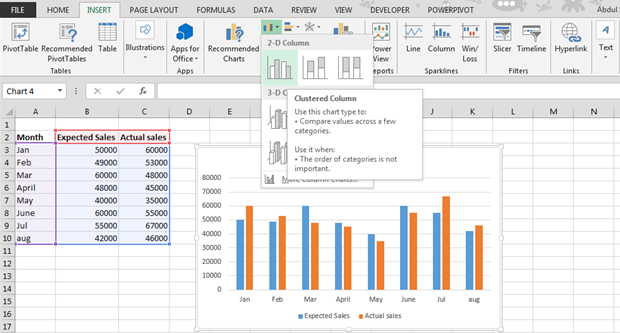
In this Excel tutorial, you will learn how to insert a chart with your data and the goal line that was expected. This kind of chart is best for sales/production reports or business plans for the company you want to establish.