Best Excel Tutorial
Excel Skills Simplified: Tutorials That Actually Work
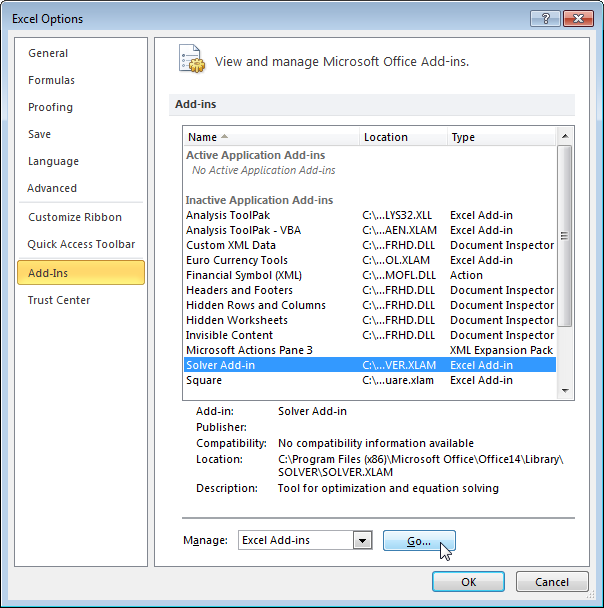
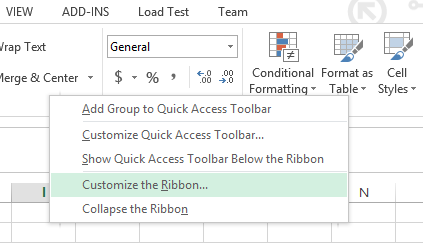
How to Use Solver in Excel: Complete Guide for Optimization
The solver in Excel is a powerful analysis tool for optimization known as “What-If analysis”, and this comprehensive tutorial will help you use it to ascertain an optimal value in one cell known as the “target cell”.
Basically, a solver is used for a group of cells that are directly or indirectly related, enabling professionals to apply constraints to minimize or maximize values. In this step-by-step tutorial, we will guide you on how to use Solver to find a solution to a business problem and optimize your data analysis results.
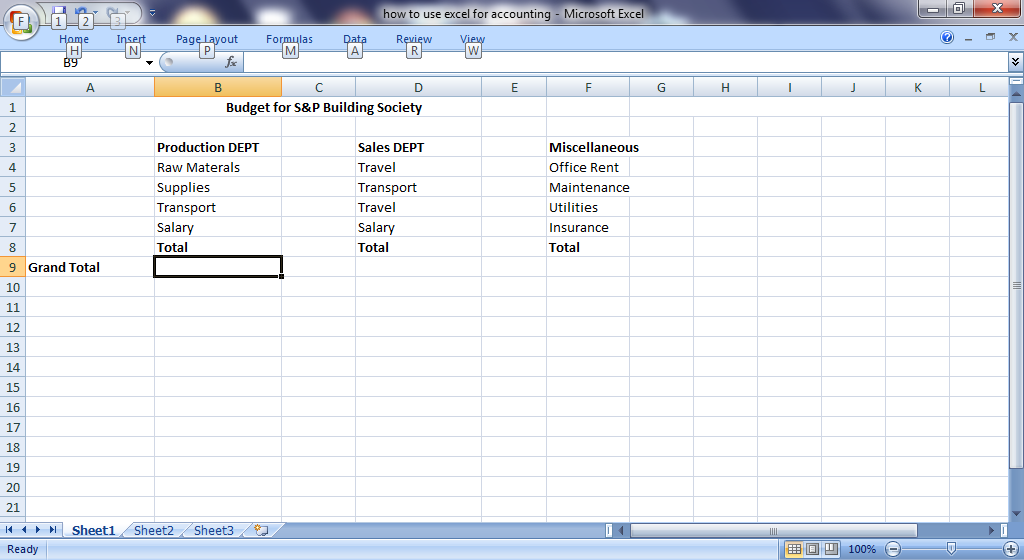
How to Create a Business Budget in Excel
A company budget is a financial plan that outlines how a business will spend its money over a specific period of time. Budgets are typically created on an annual basis, but they can also be created for shorter periods of time, such as quarterly or monthly.
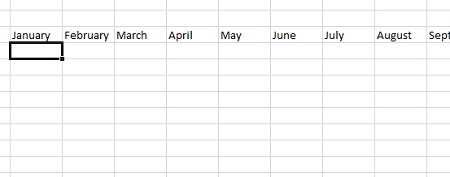
How to Create a Household Budget in Excel
Excel is a very important application for the planning of household budget. A complete plan with Excel can help you see your expenses and incomes at a glance, ensuring that you plan your family’s finances effectively.
With Excel, you can automatically update changes using spreadsheet calculations. Preparing your household budget in this manner can help you do a lot of things such as planning for holiday expenses or preparing for Christmas.
How to Create a KPI Dashboard in Excel: Complete Guide with Step-by-Step Examples
Excel Dashboard reports are becoming increasingly popular these days and serve as essential tools for businesses to visualize and analyze data. In this comprehensive tutorial on creating KPI dashboards, they help the reader quickly comprehend raw data by presenting it in virtually rich tables and charts, making them interactive and giving a comprehensive insight into business performance indicators, which makes them easier to change or filter to your preference.
Building a KPI dashboard in Excel is now simpler than ever, and this step-by-step guide requires no additional software or complex tools. If you are looking to master the process of building professional dashboards and want a complete walkthrough on creating KPI dashboards in Excel with practical examples, follow these easy steps below:
11 Best Excel Add-ins to Boost Productivity
Excel has a variety of tools that make analyzing, sorting, and compiling data easy. However, there are add-ins that can perform different functions to help you improve your efficiency and reduce the time spent on your Excel worksheet. Here are the top 11 Excel add-ins you need to incorporate into your Excel sheet for more efficiency.
How to Reference a Cell in Excel Vba
In this article, we are going to learn how to refer to a cell in VBA. When using one of the most common task is to refer to a cell or a range of cell and then do something to it like changing the format of the cell or entering a formula in the cell. An example is highlighting the cell A1.
How to create a toggle button in Excel
In this article, we are going to learn how to insert and use a toggle button in an Excel worksheet. A toggle button is used to indicate a state, such as Yes/No or a mode, such as On/Off. The button alternates between an enabled and disabled state when it is clicked. For example, you can use the toggle button to hide and unhide rows, hide and unhide columns, hide and unhide a chart, switch between design mode and edit mode, or as an alternative to the check box. Either way, you can see that toggle buttons are very useful.
How to Add Scroll Bar in Excel
In this Excel lesson, you will learn how to insert Scroll Bar to your worksheet. Also you will find out how useful is to insert it to make your worksheet more interactive and dynamic.
How to Declare Variable in Excel VBA
In this article, we are going to learn how to declare a variable in VBA Excel. First, we are going to learn what a variable is and then some of the types of variable are. Finally, we are going to learn how to initialize and use variables in Excel VBA.