How to Make a Bar Chart
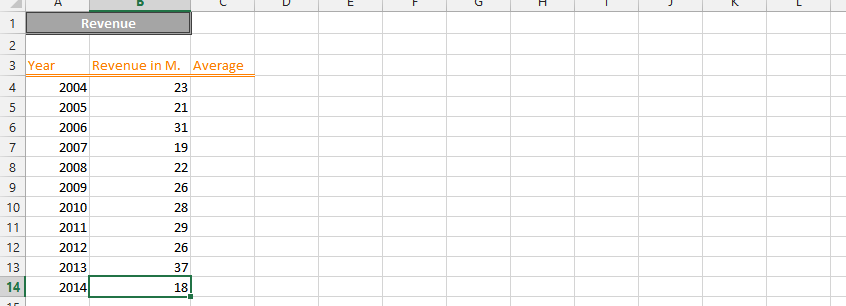
Every Excel tutorial needs to contain how to make a bar chart lesson. Bar charts are one of the simplest ways to represent a collection of data. Also, creating a bar chart is just a matter of a few clicks in Excel.
This is an ultimate guide to cover up creating and formatting bar charts, types of bar charts and its limitations.