How to Add Special Characters in Excel
The special characters in Excel can be understood in different ways. How to deal with it when using it depends on the person using it.
Excel Skills Simplified: Tutorials That Actually Work
The special characters in Excel can be understood in different ways. How to deal with it when using it depends on the person using it.
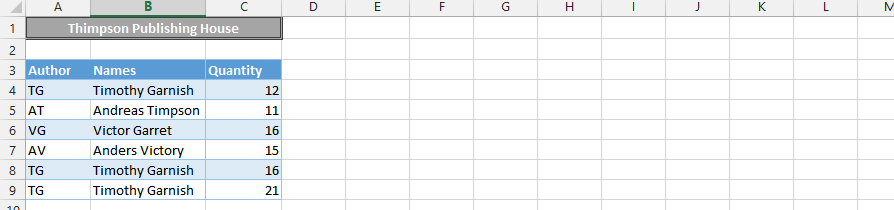
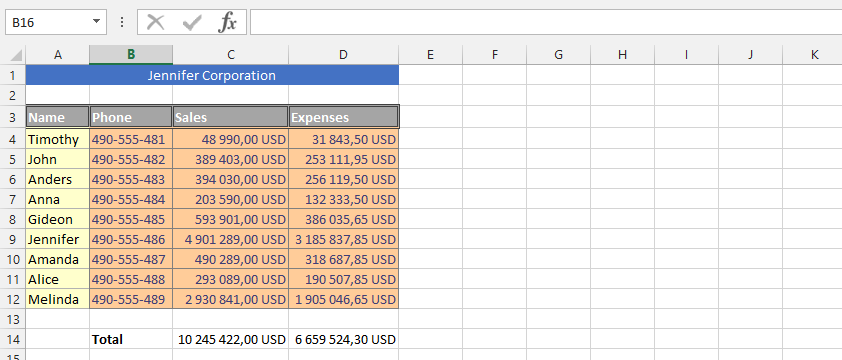
In Excel, you can perform a many-to-many lookup to find multiple values based on a single criterion. This is useful for tasks such as finding all the books that a certain author has written for a specific publisher, or all the products that a certain customer has bought from a specific store.
We will show you how to perform a many-to-many lookup in Excel using different functions and formulas.
Learn how to increment row number in Excel formulas using ROW() and OFFSET() functions. This comprehensive tutorial teaches you how to create dynamic formulas that automatically adjust and increment row ranges. Master the techniques to increment row numbers for more flexible and powerful Excel calculations.
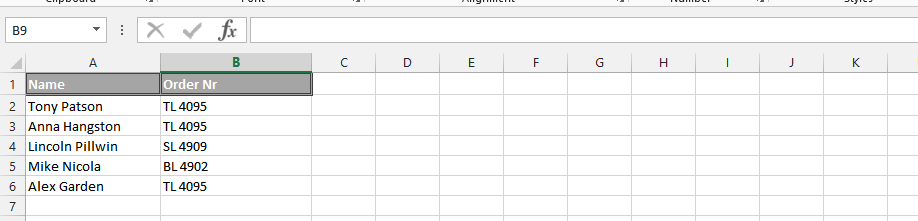
In this Excel tutorial, you will learn how to do a vlookup with multiple criteria in Excel.
In this Excel tutorial, you will learn how to countif cells with partial match in Excel. The efficiency of using the countif partial text is its contribution to a productive end-result.
To create a dynamic Pivot Table that refreshes automatically, you need to start with data in a table format. The table must have headers, and the data must be in a consistent format.
Calculating overtime hours in Excel is indeed a useful skill, especially for HR and payroll professionals. The calculation of work overtime is dependent on knowing when an employee starts and when he or she finishes for the day.
In this Excel charting tutorial, you will learn how to make a stock chart in Excel. You can use such a graph everytime you have open, high, low, close data values.
It is a pity that the ogive chart is not a defined chart type in Excel. I sometimes use it and for this reason I have to do an ogive graph step by step. Below I will show you how to easily create an ogive chart in Excel.