How to test Statistical Significance by T-test?
A t-test is a statistical test that helps to determine if there is a significant difference between the means of two sets of data. In MS Excel, we can easily test statistical significance by using the function TTEST. First, take a moment to understand the parameters of this function.
Ttest function syntax
=TTEST(array1, array2, tails, type)
Array1 (Required): Range for dataset 1
Array2 (Required): Range for dataset 2
Tails (Required): This determines if it is a one-tail T-test or two tail T-test.
- 1: One tail T-test
- 2: Two tail T test
Type (Required): Type of t-test
- 1: Paired T-test, i.e. if the two data sets are related to each other
- 2: Unpaired T-test, the two samples have equal variance
- 3: Unpaired T-test , the two samples have unequal variance
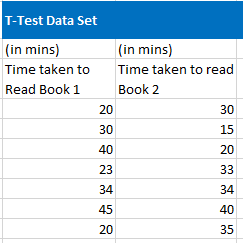
T-test formula example
Example:
1. Consider the following dataset for T-test.

2. Select the two datasets and place them in array1 and array2.

3. On an Empty Cell, write the formula to perform 1-tail Paired T test

The one‑tailed probability is shown here.

4. Similarly, perform a two–tailed paired T test
![]()
The two‑tailed probability is shown below it.
![]()
Based on the obtained value you can accept or reject the null hypothesis. If the T-test gives the probability less than 0.05, then reject the null hypothesis. This means there is less than 5% probability that the null hypothesis is true.
In this example, the p‑value is greater than 0.05 in both cases, so we fail to reject the null hypothesis.


Leave a Reply