How to Find Outliers in Excel
In this article, we will learn how to find outliers in Excel.
What are Outliers?
Outliers are the values in the data which are outside the scope of the general data values, meaning that they are very much higher than very much lower than the general data values.
Why do we need to remove the Outliers?
Outliers spoil our data and representation. When we create a graph of complete data, if some values are extremely high and extremely low, the other values/range of the graph do not look good.
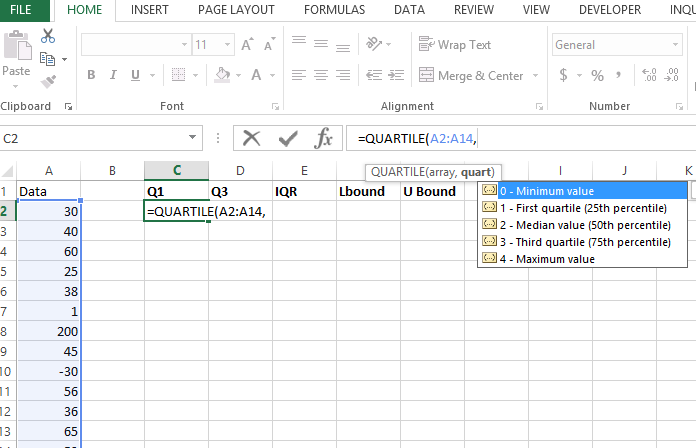
First, create a simple sample data set. In this example, you can clearly see that some values, such as 200, sit far outside the rest of the data.
Now discuss the procedure to remove outliers. Start by finding the first and third quartiles:
1st quartile: =QUARTILE(A2:A14,1)

Third quartile (Q3): =QUARTILE(A2:A14,3)

How to calculate interquartile range?
Next, calculate the interquartile range (IQR) by subtracting Q1 from Q3: IQR = Q3 – Q1.

Calculating IQR gives us the possibility to calculate the lower and upper bounds of data.
Then calculate the lower bound and upper bound values:
Lower bound: Q1 – 1.5 * IQR

Upper bound: Q3 + 1.5 * IQR.

To flag outliers, use the lower and upper bounds in a formula such as =OR(A2<$F$2, A2>$G$2).
Any value below the lower bound or above the upper bound counts as an outlier.
In Excel, you can mark outliers with a conditional formula such as =OR(value < (Q1 – 1.5 * IQR), value > (Q3 + 1.5 * IQR)) and then apply conditional formatting to highlight those values.


Leave a Reply