How to Insert Variance-Covariance Matrix in Excel for Statistical Analysis
The variance-covariance matrix is a way to describe patterns of data. This statistic can be used as an overview for many multivariate statistical models.
Before generating a matrix, you will need to have the data listed within a table. The table must have labels clearly identifying the random variables as Excel uses these headings when generating the matrix.
For the purposes of this guide, test data has been created for you to use to calculate a sample variance/covariance matrix. The sample data is of price observations from four companies.
Steps to create a Variance-Covariance Matrix
The steps below will take you through the process using some sample data. A quick reference guide is available at the end of this document.
Adding the Analysis ToolPak to the Data tab
If the Analysis section on the Data tab is visible, you can skip theses steps.
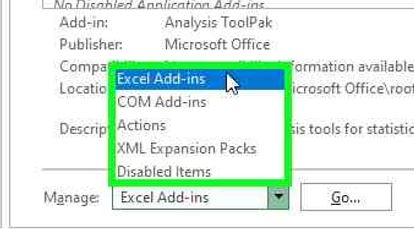
If the Analysis section is not activated, follow these steps to activate the Analysis ToolPak. In Excel, click File. Click Options. In the Excel Options window click Add-ins, in Manage select Excel Add-ins, click Go.

The Add-ins window opens, select Analysis ToolPak and click OK.

The Analysis section is now active on the Data tab.

Generating the Variance-Covariance Matrix
Open the Variance-Covariance Matrix sample data spreadsheet.
On the Data tab, click Data Analysis. In the Data Analysis window, select Covariance, click OK.

The Covariance window opens, click the Input Range arrow.

The Covariance window contracts to the Input Range field, select the data excluding the Dates column, be sure to include the labels at the top of the columns.

Click the Input Range arrow again, the window expands. Click Labels in First Row.

In Output options click the Output Range arrow.

The Covariance window contracts to the Output Range field.

Click in cell I5, this identifies where Excel will display the matrix.

Click the Output Range arrow again, the Covariance window expands. Click OK.

Excel creates the Covariance matrix and displays it in cell I5. The column headings selected earlier are included in the matrix.

Quick reference guide
Steps to add the Analysis ToolPak
- In Excel, click File.
- Click Options.
- In the Excel Options window click Add-ins, in Manage select Excel Add-ins, click Go.
- The Add-ins window opens, select Analysis ToolPak and click OK.
- The Analysis section is now active on the Data tab.
Generating the Variance-Covariance Matrix
- Open the spreadsheet with the data you wish to analyse.
- On the Data tab, click Data Analysis. In the Data Analysis window, select Covariance, click OK.
- In the Covariance window for statistical analysis, click the Input Range arrow
- The Covariance window contracts to the Input Range field, select the data excluding the Dates column, be sure to include the labels at the top of the columns.
- Click the Input Range arrow again, the window expands. Click Labels in First Row.
- In the Output options section for variance analysis, click the Output Range arrow to specify where the covariance results will be displayed.
- The Covariance window contracts to the Output Range field.
- Click in a cell where you want Excel to display the results.
- Click the Output Range arrow again, the Covariance window expands. Click OK.
- Excel creates the Covariance matrix and displays it in cell selected above. The column headings selected earlier are included in the matrix.


Leave a Reply