How to Calculate Chi Square in Excel
The Chi-Square test is a statistical test used to determine if there is a significant association between two categorical variables. In this Excel tutorial, you will learn how to calculate the Chi-Square test in Excel.
Why to use?
Chi-Square test is used to assess the relationship between qualitative variables (unmeasurable), and there are many of them in economic research.
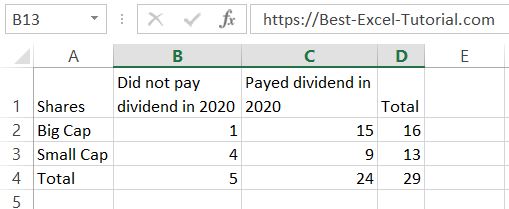
Having big cap and small cap shares in our portfolio let’s check the hypothesis using Chi Square test in Excel. We investigate whether there is a relationship between company size and the propensity to pay dividends.
The first step in calculating a Chi-Square test in Excel is to prepare your data. You need to have two categorical variables, one for each column in your spreadsheet.

Chi square calculations
Next, calculate the theoretical (expected) values.
To calculate theoretical values for big cap companies you need to multiply total number of big cap companies and total companies which did not pay out dividends. Then divide this number by the total number of companies.

Theoretical values formula is =B$4*$D2/$D$4.
For other companies, calculate it using the same pattern.
Note: The formula uses absolute references.
Having theoretical values you are able to perform Chi Square test.
Use the CHISQ.TEST function in Excel to perform this test.

Chi Square test formula is =CHISQ.TEST(B2:C3,B7:C8)
- B2:C3 is for current values.
- B7:C8 is for theoretical values as you calculated minute before.
Once you have calculated the p-value, you can interpret the results of your Chi-Square test. If the p-value is less than a predetermined significance level (usually 0.05), you can reject the null hypothesis and conclude that there is a significant association between the two categorical variables. If the p-value is greater than the significance level, you cannot reject the null hypothesis and conclude that there is not enough evidence to support a significant association between the two categorical variables.
In my example, the Chi-Square Test equals 0.082, which is more than the significance level of 0.05.
This result means that, in 2020, the willingness to pay dividends did not depend on the size of the company.
You can download the spreadsheet from here.


Leave a Reply