How To Create A Territory Map In Excel?
Typically, we can create territory maps when we wish to compare statistics visually across multiple geographical areas. For example, you might create one to compare births or tax revenue by state, city, or country.
After you have acquired and selected the data, Excel automatically generates the territory map and uses differing levels of shading to indicate the level of values by geographical areas in the data.
Table of Contents
Steps To Create A Territory Map
Below, the steps will take you through the process using sample data. Additionally, a quick reference guide is available at the end of this document.
1. Source the data you wish to use for the territory map. Points to consider:
- Where using states or towns names that exist in several locations – e.g., London, UK, London, Ontario, Canada – you must include a column with the country so Excel can pinpoint which London you are referring to otherwise the map will be blank.
2. Open the spreadsheet How To Create A Territory Map In Excel – sample data.
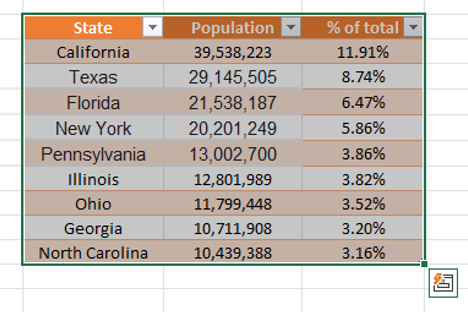
3. Select the whole table.

4. On the menu select Insert, in the Charts group, click Maps, Filled Map. Excel generates the map using the population data by state. The level of shading in each state is relative to its population density compared to other states.
Note you may receive a message from your search engine provider requesting permission to use data in your spreadsheet to create the map. You’ll need to approve if you wish to complete these steps.

5. Excel displays a Chart Design tab whenever your cursor is on a chart. Use this tab to edit or format the appearance of the map.
Quick Reference Guide
1. Source the data you wish to use for the territory map. Points to consider:
- Where using states or towns names that exist in several locations – e.g., London, UK, London, Ontario, Canada – you must include a column with the country so Excel can pinpoint which London you are referring to otherwise the map will be blank.
2. Open the spreadsheet How To Create A Territory Map In Excel – sample data.
3. Select the whole table.
4. On the menu select Insert, in the Charts group, click Maps, Filled Map. Excel generates the map using the population data by state. The level of shading in each state is relative to its population density compared to other states.
Note you may receive a message from your search engine provider requesting permission to use data in your spreadsheet to create the map. You’ll need to approve if you wish to complete these steps.
5. Excel displays a Chart Design tab whenever your cursor is on a chart. Use this tab to edit or format the appearance of the map.


Leave a Reply